EUR/AUD Bullish ABC Zigzag Towards -61.8% Fib Target
September 13, 2021
EUR/AUD Technical Analysis
- A bullish ABC zigzag pattern is expected.
- The main target for the bulls is the -61.8% Fibonacci level.
- A head and shoulders resistance level could cap the upside.
- A bearish bounce could take place at the target and resistance.
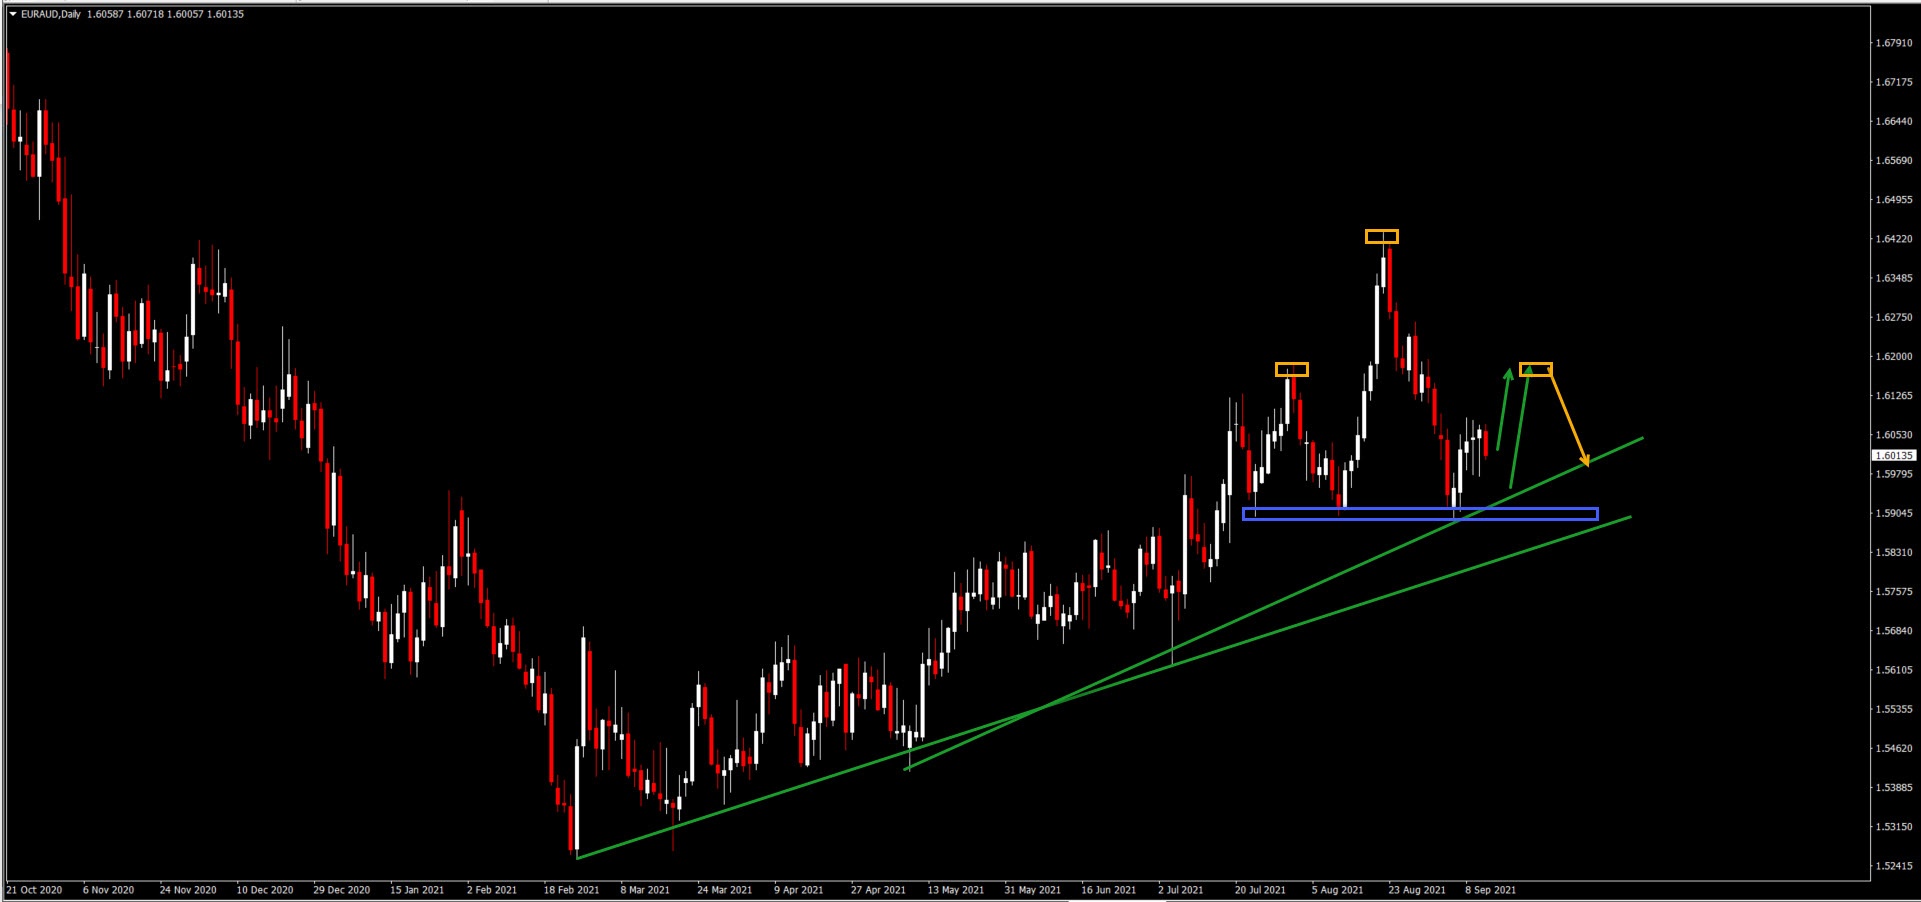
Daily Chart EUR/AUD
The EUR/AUD uptrend remains valid on the daily chart. Price action stayed above the key support trend line (green) and previous bottoms (blue box). What do we expect next?
- The EUR/AUD has already made a bullish bounce at the support zone.
- One more bullish swing is expected (green arrows) to retest the head and shoulders resistance zone (orange boxes).
- A bearish bounce should take place at that resistance zone to test the support (green).
- Price action could either breakout immediately or after a small retest of the support trend line (green).
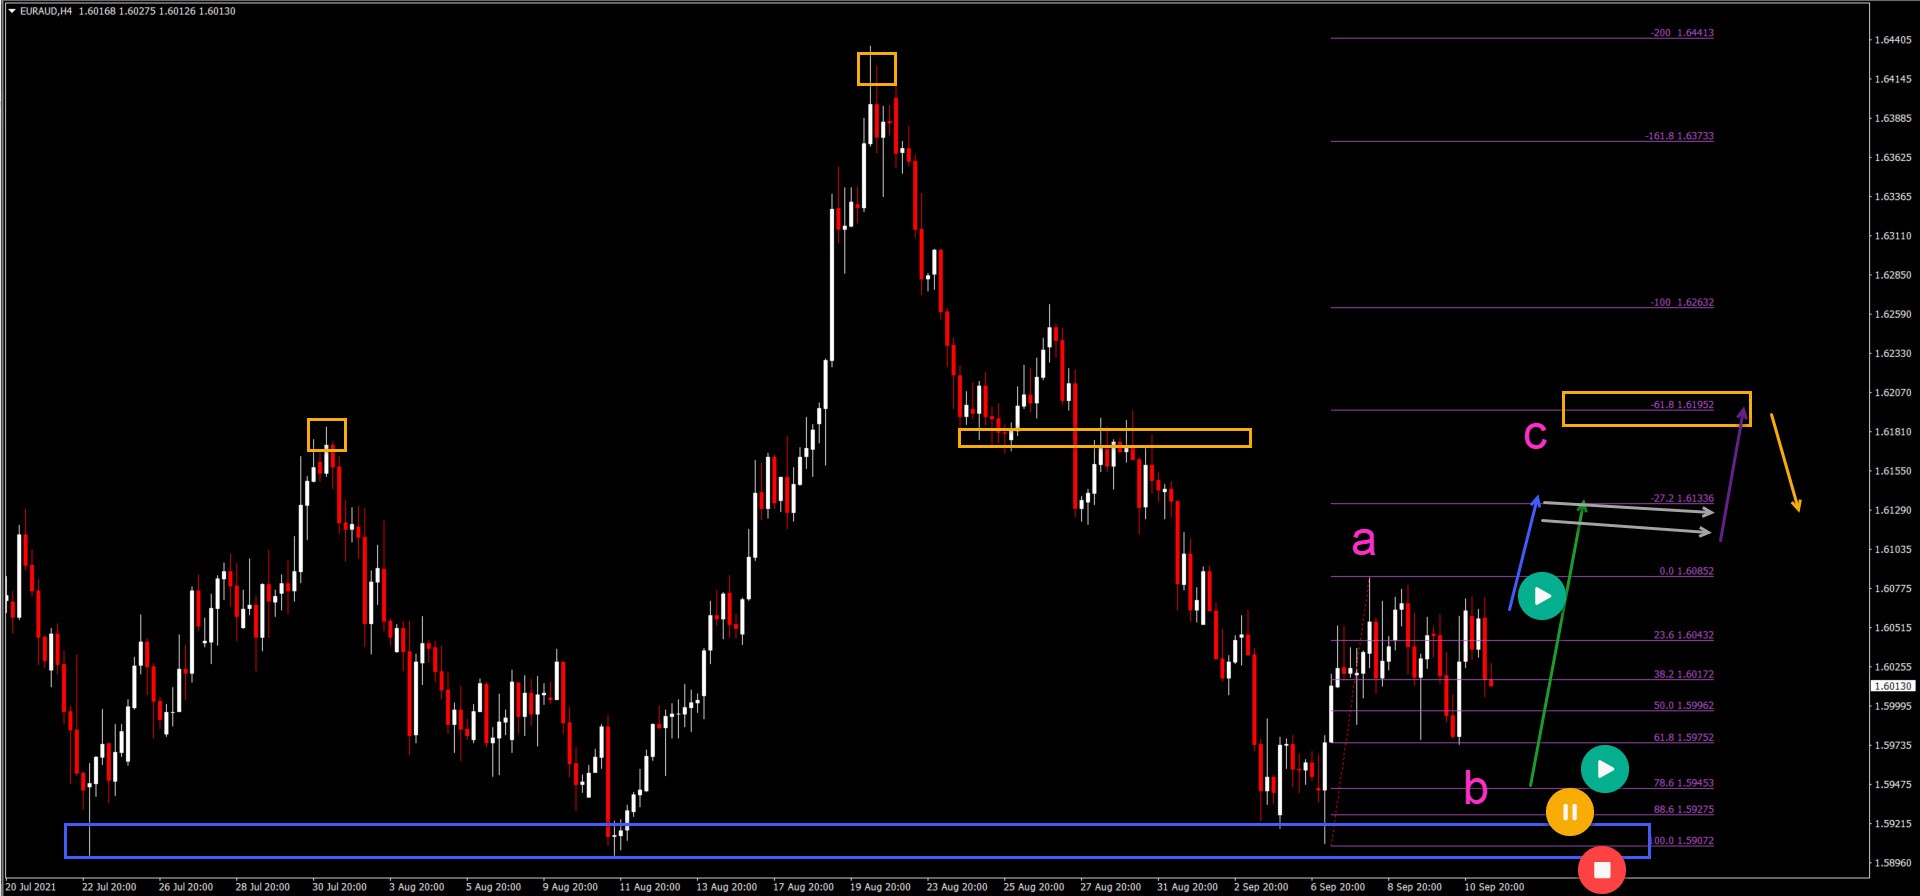
4 Hour Chart EUR/AUD
The EUR/AUD on the 4 hour chart is showing a hefty roller coaster ride. The bullish price swings are immediately followed by equally strong bearish price swings:
- The bullish bounce at the support zone (blue box) has probably created a wave A (pink).
- The bearish pullback has not broken the recent bottom and remains choppy. This indicates a wave B (pink) retracement.
- Price action is now expected to be in a wave C (pink). A break above resistance (grey box) confirms a bullish breakout (blue arrow).
- A deeper retracement towards the 78.6% Fibonacci level indicates that price action is still in a wave B (pink).
- The first target is the -27.2% Fibonacci level at 1.6125. A bull flag pattern (grey arrows) is expected.
- The main target is the -61.8% Fibonacci level at 1.62.
- A break below the bottom invalidates (red sign) the expected bullish ABC (pink).
- A bearish reversal could take place at the 61.8% Fibonacci target and resistance zone (orange boxes).