GBP/USD Bounce at Support Shows Bearish ABCDE Triangle
September 20, 2021
GBP/USD Technical Analysis
- GBP/USD daily chart made a bearish breakout
- A bullish bounce at the support trend line could start an ABCDE triangle pattern
- A bearish bounce at the resistance could mark the end of the wave E
- The bears remain in control below 1.40.
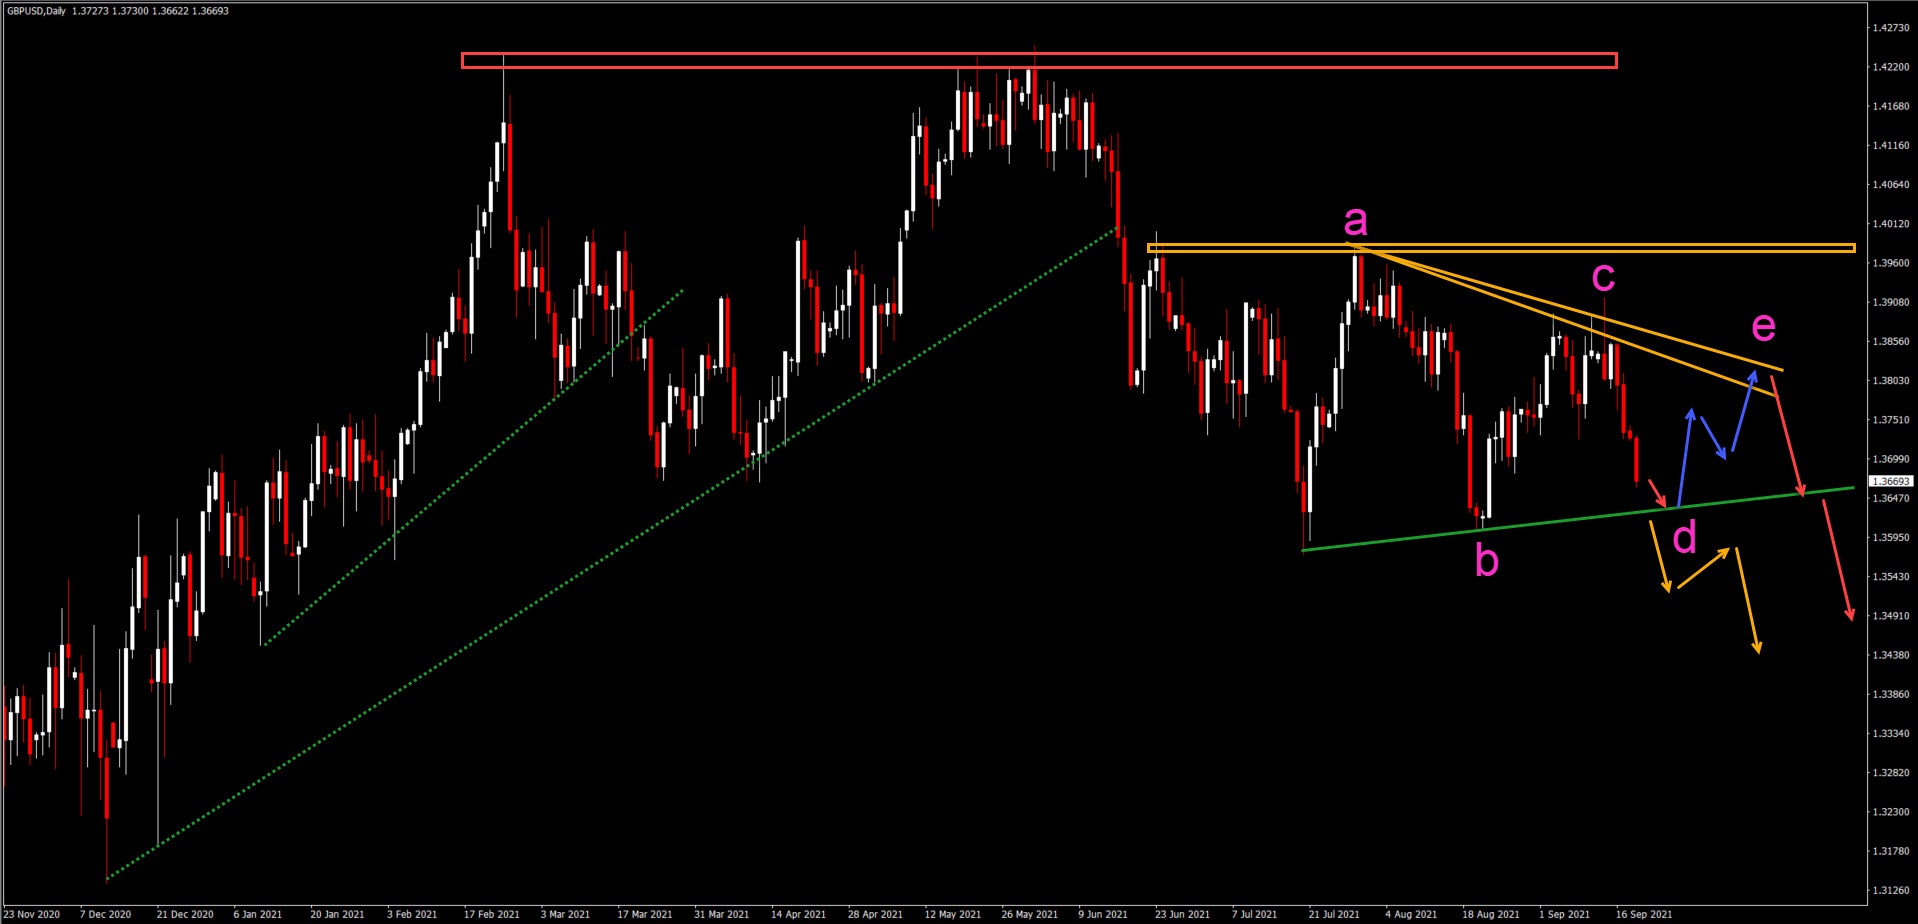
Daily Chart GBP/USD
The GBP/USD daily chart made a bearish breakout below the key support trend line (dotted green). This happened after a double top chart pattern (red box):
- The daily chart seems to be under bearish pressure – unless price action breaks above the current resistance (orange lines and box).
- Price action is now close to testing the support trend line (green).
- A bullish bounce at the support could create an ABC pattern (blue arrows) back to the resistance line (orange).
- A bearish bounce at the resistance (red arrows) could confirm a bearish ABCDE (pink) triangle pattern.
- Price needs to break below the support (green) for a bearish breakout (red arrows).
- An immediate bearish breakout could indicate a downtrend (orange arrows).
- The first bearish target is the round psychological level at 1.35.
- Further bearish targets are located at 1.34, 1.33 and 1.3250.
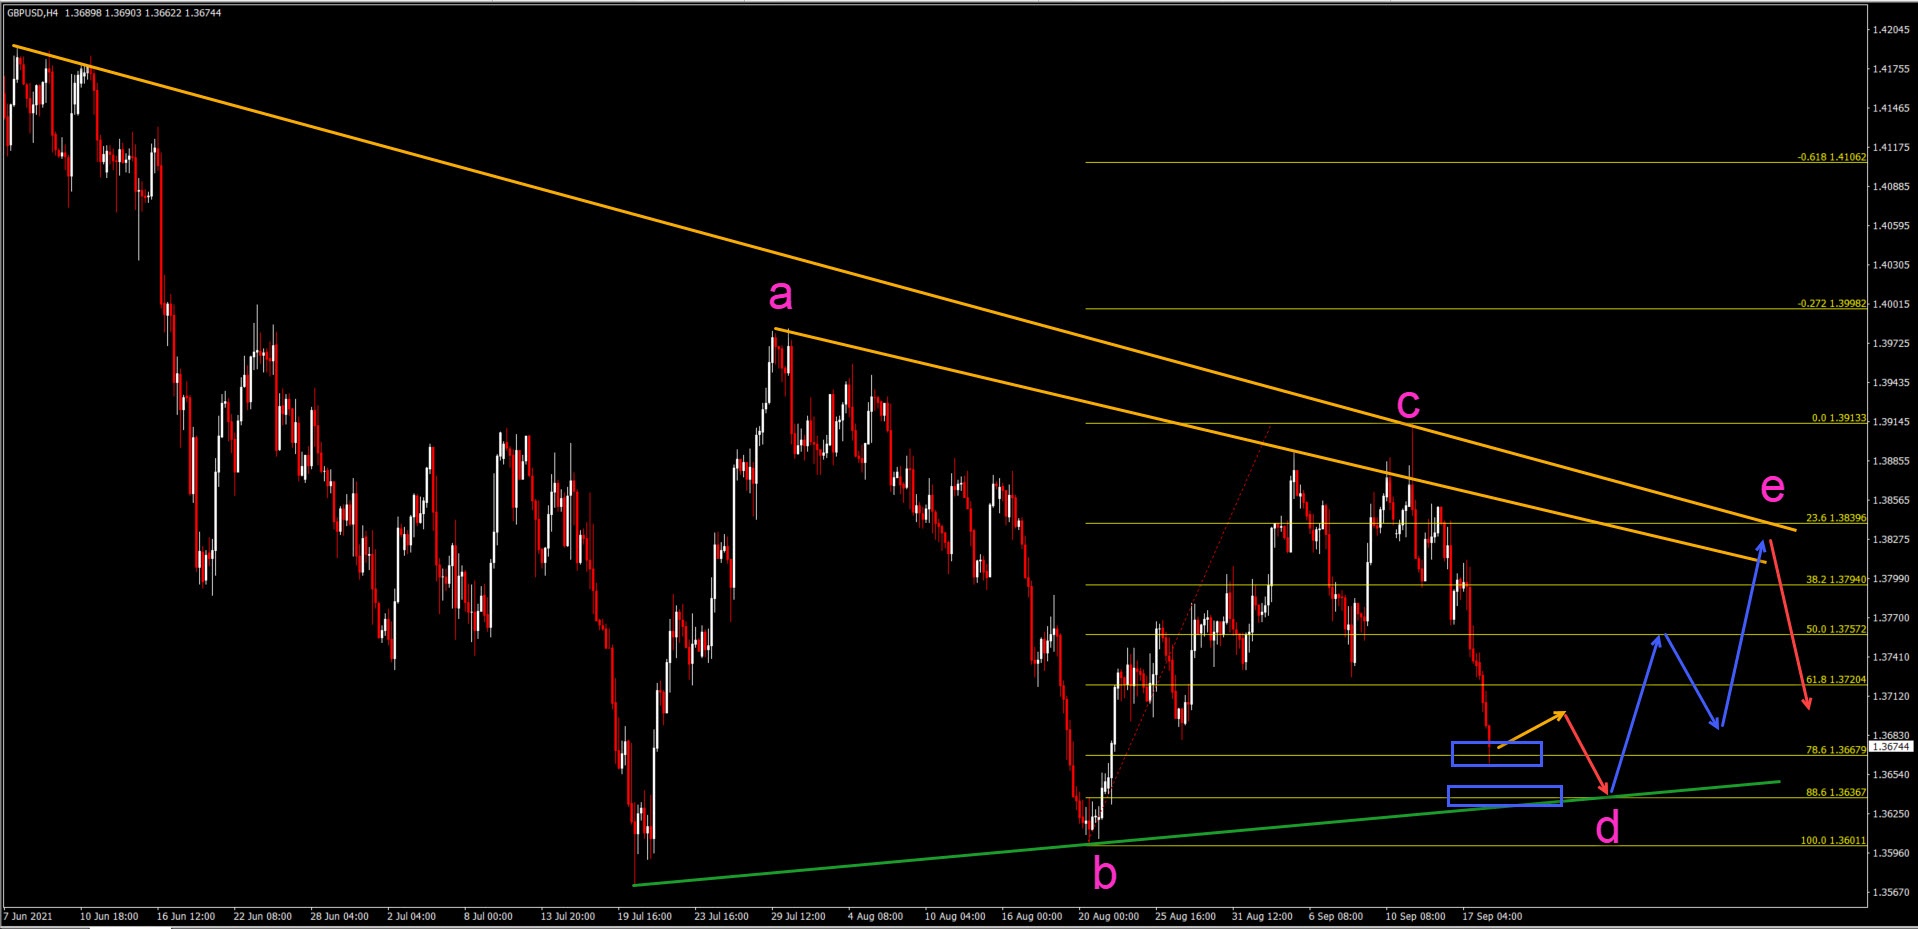
4 Hour Chart GBP/USD
The GBP/USD 4-hour has reached the 78.6% Fibonacci retracement level:
- The support zone could create a bear flag chart pattern (orange arrow).
- A test (red arrow) of the 88.6% Fibonacci retracement level is expected due to the strong bearish momentum.
- A bullish bounce (blue arrows) at the 88.6% Fib could create a wave D-E (pink) pattern.
- A break below the bottom and 100% Fib level, however, invalidates the ABCDE triangle pattern.
- In that case, an immediate bearish breakout and downtrend is taking place.
- A break above the top of wave A and C indicates that a bearish triangle pattern is probably not taking place.
- A break above the resistance trend line could also indicate a bullish triangle chart pattern, rather than a bearish triangle chart pattern.