


 Open Live Account
 Try on Demo
 Trading Fees
 Forex
Forex EUR/USD
 USD/JPN
 USD/GBP
 CFDs on Stocks
 Apple
Apple Amazon
 Tesla
Tesla CFDs on Crypto
 USD/BTC
 USD/ETH
 JPY/BTC

- Learning how to read stock charts is very easy and can help you better analyze the market
- There are different types of charts available giving you different types of information about the market
- You can use different timeframes to see the price movements in greater detail
- Traders can use indicators on charts to predict the possible price movements
How To Read Stocks - Use Indicators
Reading stock charts explained: Reading stock charts can help you understand the market a lot better While trading stocks, you will be required to follow different types of indicators and analyze data to decide what positions you have to open. One of the things that you should take your type to learn is to know how to read stock charts.
There are different types of charts available in the market and all of them work differently. While some of them offer you only general information about the price movements of certain stocks, others can give you a more detailed insight into the price movements in the market.
Charts also help you to use indicators that will assist you in the decision-making process. There are numerous things that you can learn from charts, including P/E ratio, EPS ratio, open and close prices, and many others.
In this guide to reading stock charts, we will discover all the different ways you can use stock charts to better analyze the market.
While trading stocks, you will be required to follow different types of indicators and analyze data to decide what positions you have to open. One of the things that you should take your type to learn is to know how to read stock charts.
There are different types of charts available in the market and all of them work differently. While some of them offer you only general information about the price movements of certain stocks, others can give you a more detailed insight into the price movements in the market.
Charts also help you to use indicators that will assist you in the decision-making process. There are numerous things that you can learn from charts, including P/E ratio, EPS ratio, open and close prices, and many others.
In this guide to reading stock charts, we will discover all the different ways you can use stock charts to better analyze the market.
P/E Ratio
In the stock trading market, one of the most important pieces of information that indicates how much it is worth to invest in any of the stocks is the P/E ratio. It is a classic measure of any asset value. It indicates how many years of profits it takes to recoup an investment in the stock. The average level of the P/E ratio in the modern market is about 19.6. The P/E ratio of a certain stock can be used by traders to determine overvalued or undervalued stocks in the market. In the stock trading market, P/E ratios are seen as one of the main indicators of fundamental analysis and are very commonly used by traders. The P/E ratio is the ratio of the stock price divided by the firm's yearly earnings per share. This ratio is calculated by using the last reported actual earnings of the company. But, thanks to the fact that you can read a stock graph, you do not have to calculate the ratio manually. There are numerous indicators available in the market that do the hard job for you.EPS Ratio
 Another very important measurement in the market that a lot of stock traders are using is the earnings per share, EPS, ratio. This ratio measures how many dollars of net income have been earned by each share of the common stock during a specified period.
This ratio is calculated by dividing the net income by the number of shares available in the market. This can be used to measure the profitability of the company shares you are planning to invest in.
If you manage to learn how to read a stock chart, you can use indicators created for trading platforms to automatically determine the EPS ratio of the stock that you are planning to trade. This indicator, much like most of the indicators in the market, can be applied directly to the chart and can be very easy and useful for traders in the stock market while deciding whether or not you should invest in a certain stock.
Another very important measurement in the market that a lot of stock traders are using is the earnings per share, EPS, ratio. This ratio measures how many dollars of net income have been earned by each share of the common stock during a specified period.
This ratio is calculated by dividing the net income by the number of shares available in the market. This can be used to measure the profitability of the company shares you are planning to invest in.
If you manage to learn how to read a stock chart, you can use indicators created for trading platforms to automatically determine the EPS ratio of the stock that you are planning to trade. This indicator, much like most of the indicators in the market, can be applied directly to the chart and can be very easy and useful for traders in the stock market while deciding whether or not you should invest in a certain stock.
Open & Close Prices
There are numerous different types of charts available in the stock trading market. While some only give you general information about the direction of the market, others can provide you with much more detailed information about the trading market and the price movements in the market. Among the types of charts that give you information about the open and close prices of the charts are Heiken Ashi, regular bar chart, candlestick charts, and many others. By understanding how to read charts like these, you can better plan your positions in the market. These chart types are very useful because they can show traders increasing or decreasing momentum. For example, when the open and close are far apart from each other, it shows strong momentum, and when they are close together, it indicates that there is a weak momentum in the market. In addition to these two price levels, the above-mentioned chart types are also showing you information about the high and low prices of the day for the asset you are trading. This information is very useful when it comes to assessing volatility in the market. These types of charts can be applied to any timeframe, making sure to offer you a high level of flexibility. Understanding stock market numbers and the changes that are happening in the market are very easy with this type of chart and offer traders a very detailed and good insight into the stock trading market. Understanding such detailed information can be very important for traders using any strategy. This is one of the main reasons why you should learn how to read stock trading charts.Support & Resistance (Yearly, Monthly, Weekly, Daily)
One of the biggest advantages of knowing reading stock charts is that you will be able to identify support and resistance levels easier. These terms are used when traders refer to certain price levels on the chart that tend to act as barriers that prevent prices from pushing a certain level. Technical analysts use support and resistance levels to identify the price points that basically act as "stop signs" for the prices to go beyond or below a certain level. Support is a price level where a downtrend is expected to pause, while resistance is a price level where the uptrend is expected to pause. These areas on the charts can be identified using trendlines and moving averages. For example, below, you can see a Candlestick Chart, where you can easily identify support & resistance levels.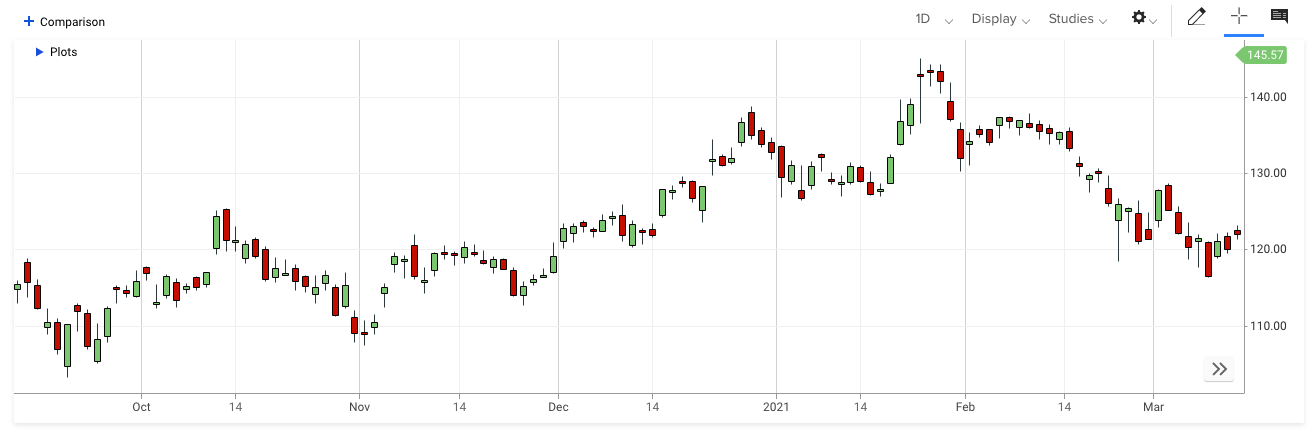 There are many characteristics of support and resistance levels that can help you identify them on the chart. One of them is that in most cases, stock prices tend to have a difficult time moving beyond a round number, such as $100, for example.
The majority of traders are using moving averages and other technical indicators to predict future short-term momentum. Among the indicators that you can use to determine potential support/resistance levels are Fibonacci retracement, volume indicators, and many others.
There are many characteristics of support and resistance levels that can help you identify them on the chart. One of them is that in most cases, stock prices tend to have a difficult time moving beyond a round number, such as $100, for example.
The majority of traders are using moving averages and other technical indicators to predict future short-term momentum. Among the indicators that you can use to determine potential support/resistance levels are Fibonacci retracement, volume indicators, and many others.
Yearly, Monthly, Weekly, And Daily Highs And Lows
Learning how to read a chart for stocks correctly is the foundation of all technical analysis. Reading the charts incorrectly means that all analysis done as a result of the information gathered from the chart is incorrect. The simplest way to read the chart is to identify the cycles on the chart by finding its highs and lows. Depending on the type of trader you are, you will be looking for different types of highs and lows in the market. If you are a short-term investor who wants to make profits in the short term, you will be looking for the highs and lows on the chart that shows price movements in a short period. On the other hand, as a long-term investor, you might be looking at the chart in a bigger picture and you