


 Open Live Account
 Try on Demo
 Trading Fees
 Forex
Forex EUR/USD
 USD/JPN
 USD/GBP
 CFDs on Stocks
 Apple
Apple Amazon
 Tesla
Tesla CFDs on Crypto
 USD/BTC
 USD/ETH
 JPY/BTC

- The S&R indicator is one of the best indicators
- It's very useful for reading charts and analyzing prices
What Are The 3 Key Steps With Support & Resistance Levels?
Do you feel overwhelmed when looking at a price chart? Are you sometimes confused by contrary information and signals? Paralysis of analysis is often a common problem for traders… Simply because the price chart offers a wide range of trading ideas. The trick is to focus on setups that offer a positive expectancy in the long term. In this article, you will learn three key ingredients for simplifying your analysis and trades:- Letting price action decide, which is key for any price action strategy.
- Focusing on key moments using the BPC concept (break, pullback, and continuation pattern).
- Understanding that the best breakouts occur around strong support and resistance.
Why Are Support & Resistance Levels Key For Trading?
Support and resistance (S&R) offer traders a short-cut for finding key moments (also called decision zones). Basically, S&R offers a trading edge on the price chart. Why? Because price action in Forex trading is expected to make a critical decision when approaching the support and/or resistance zones:- Break the support and resistance level. This is used within a price action breakout strategy.
- Or bounce at the support and resistance level. This is used within price action bounce Forex trading.
- This is especially true if the S&R is considered strong (aka more confluence).
- There is a higher probability to find winning trades at these key S&R levels.
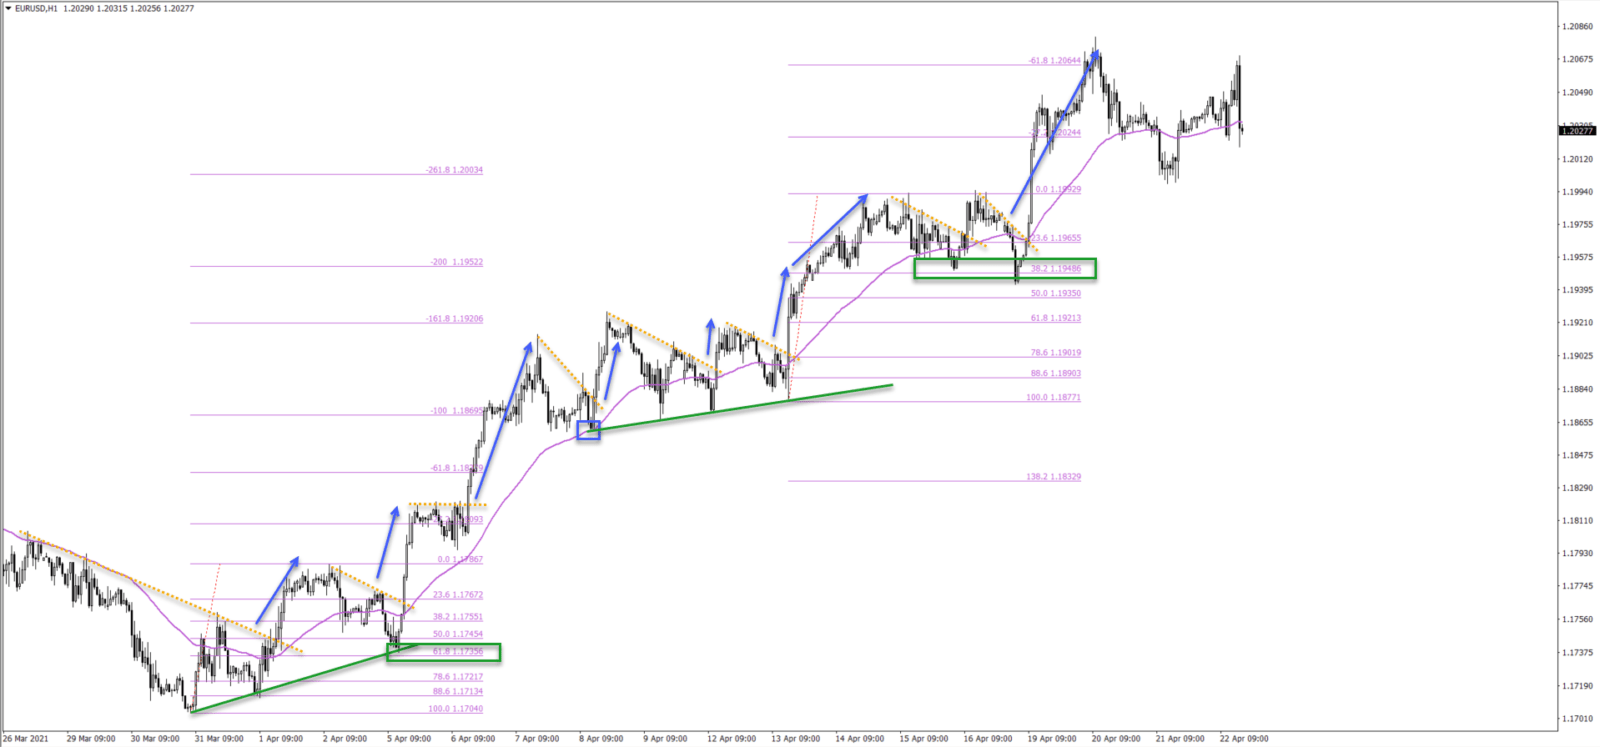 The image above shows a few practical examples of bounce and breakouts:
- The green lines indicate where price action bounced at a support trend line.
- The blue box shows a bounce at the 50 moving average.
- The green boxes indicate a bounce at the Fibonacci support levels.
- The dotted orange trend lines indicate where price action made a bullish breakout (blue arrows).
Determining Breakout Zones Using Support & Resistance
Support and resistance levels can be determined as follows:- Trend lines and trend channels.
- Fibonacci levels.
- Tops and bottoms.
- Round and quarter price levels.
- Price bands and moving averages.
- Other price indicators like Ichimoku, envelopes, parabolic, and more.
 Here is how support and resistance work in relation to price:
Resistance = Price Action Is Below The Key Level
- Breakout = price action breaks above the resistance.
- Bounce = price action bounces at or around the resistance.
Support = Price Action Is Above The Key Level
- Breakout = price action breaks below the support.
- Bounce = price action bounces at or around the support.
Understanding Price Action Trading via Candlesticks
Identifying support and resistance (S&R) alone is often not enough for finding good trades. Although more advanced traders might feel confident in trading immediately at the S&R level… However, beginning and intermediate traders are advised not to jump into any trades at the support and resistance… Why? Because correctly assuming that price action will bounce or break the S&R zone is difficult. It takes much more experience to analyze properly... And often traders will get it wrong. The safest and most solid tactic is to use price action to confirm their trading ideas at S&R zones. What does this mean?- A simpler approach is for traders to wait for the price action to make a decision.
- Traders can wait for the price to bounce at or break through the support and resistance before committing to a trade.
- A candlestick chart is one of the best ways of measuring price action in Forex and trading. Bar charts also work well but line charts do not offer the same details.
- But the charts with more price movement are usually more reliable.
- Also, charts on higher time frames usually offer strong S&R zones and more valuable candlesticks.
- Lower time frames can be used but traders need to be more cautious in their setups, take less risk, and aim at closer targets.

Work With Candle Closes
Always analyze closed candlesticks because open candles are not confirmed and traders do not know how they will close. The information can change anytime when the candle is still open.Candlestick Close Versus Open
The candlestick close versus open is key:- Bull control: a candle closes above the candle open (green box in the image above)
- Bear control: a candle closes below the candle open (orange box).
Candle Close From High or Low
Another factor is how far the candle close is from the candle high or low:- Bull control: a candle close near the candle high (green box).
- Bear control: candle close near the candle low (orange box)
- Bullish reversal: candle open and close far away from the candle low (called a wick - blue box).
- Bearish reversal: candle open and close far away from the candle high (called a wick - red box). <