


 Open Live Account
 Try on Demo
 Trading Fees
 Forex
Forex EUR/USD
 USD/JPN
 USD/GBP
 CFDs on Stocks
 Apple
Apple Amazon
 Tesla
Tesla CFDs on Crypto
 USD/BTC
 USD/ETH
 JPY/BTC

- MetaTrader 4 is one of the best-known trading platforms
- It features dozens of pre-installed trading indicators
- You can download customer MT4 Forex indicators online
- Forex trading indicators can help you predict possible changes in the market
Understanding MT4 Indicators - What Are They?
MetaTrader 4 Indicators Explained: There are 4 types of indicators traders use most. Forex MetaTrader 4 indicators are very powerful tools for technical analysis. There are millions of people using these tools to identify market trends to better understand the possible movements in the market. There are numerous indicators available for MetaTrader 4. MT4 is sometimes called the first Forex trading software. Because of this, there have been many indicators designed and created for this trading platform. In fact, you can very easily find very useful and helpful indicators for MT4 online. While the majority of MT4 indicators might cost you some money, there also are many others that are totally free. In Forex trading, indicators can be many things. In general, however, indicators are custom pieces of software that can be applied to the MT4 trading software which then makes trading slightly easier. This can help traders identify correct trends and place orders. There is a list of free MetaTrader 4 indicators available on the trading platform that come with the trading platform. The main idea behind using the Forex trading indicator is to make trading easier. Many people use indicators as a way to confirm their positions. Technical analysis is also very frequently paired with fundamental analysis for the best outcome.What Are The Best MT4 Indicators?
There are numerous Forex trading indicators available in the market. Most of these Forex trading indicators are available on MetaTrader 4, as well as on other trading platforms. While you get a number of free indicators when you download the platform, there are many others that you might need. Also, the majority of Forex brokers offer traders modified versions of MetaTrader 4, which means that there is a chance that the version you have does not come with some of the indicators. Among the most powerful technical analysis tools that are available on MetaTrader 4, you can find:- MACD
- BB - Bollinger Bands
- MFI - Market Flow Index
- SO - Stochastic Oscillator
MACD
MACD, short for the Moving Average Convergence Divergence, is a very famous trend-following momentum indicator that shows the relations between very important, two moving averages of a certain trading asset's price. To calculate the MACD, the program subtracts the 26-period exponential moving average from the 12-period exponential moving average. MACD is among the most popular MT4 free indicators because it providers traders with numerous types of information about the market. The indicator triggers technical signals when it crosses above or below the signal line and gives them information about which position is better to take. In addition, the speed of the crossovers can be taken as signals about the market conditions, whether it is overbought or oversold. It also helps traders better understand how the momentum of the market is changing. The formula of the indicator would look something like this: 12-period exponential moving average: 26-period exponential moving average. In most cases, this indicator is used to identify changes in the direction or the strength of the trend in the market. It helps traders better detect the momentum in the market and how it could change. You can see the MACD indicator applied to the GBP/USD chart on MetaTrader 4. When the MACD forms highs to lows that diverse from the highs and lows of the price, it is called divergence. Bullish divergence appears when the indicator forms two rising lows corresponding with two falling lows.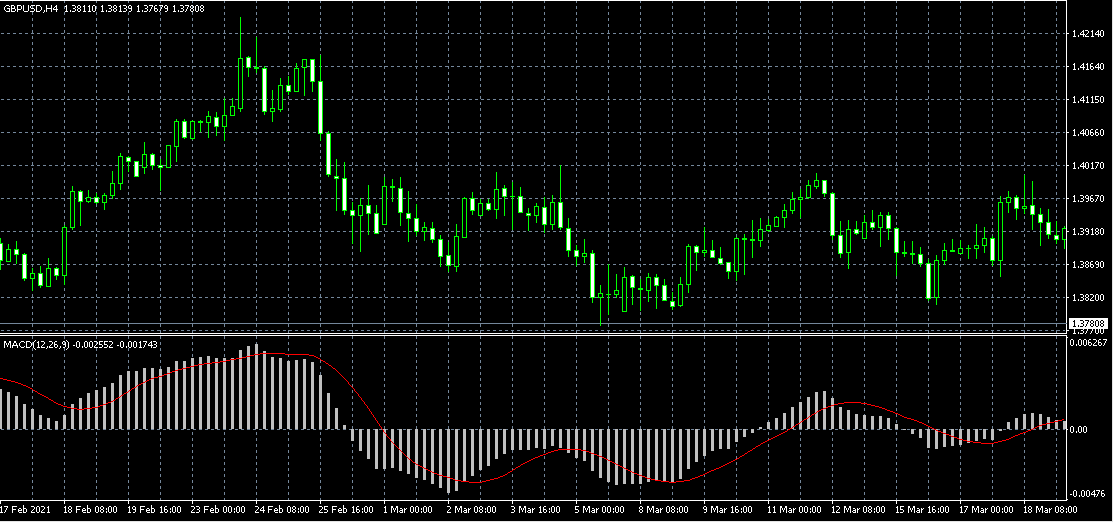
Bollinger Bands
Among the MetaTrader 4 best indicators definitely is the Bollinger Bands. This indicator represents one of the most popular technical analysis tools in the market. Thanks to this indicator, traders are able to plot trend lines that are two standard deviations away from the simple moving average price of the currency pair. This indicator is used to help traders better understand when to enter or exit a position. This is done by giving traders information about when the currency pair is oversold or overbought. The name of the indicator derives from the creator of the indicator, John Bollinger. The indicator is shown on the USD/CHF chart with red lines. As you might notice from the chart above when the prices are stable, the bands tend to be close together, however, once the prices move up, the lines, or bands, go further apart. The upper and lower bands measure the volatility of the price over time. They are mostly displayed with three lines, an upper band, a middle line, and a lower band. The middle line of the indicator is the simple moving average, and the top and bottom lines are the bands.
When it comes to MT4 Forex indicators, Bollinger Bands are among the most reliable and potent trading indicators in the market. They offer traders information about the strength of the trend, which can be used to better tell when to enter the positions.
To add it to your chart, you should go to the indicators, then MetaTrader 4 trend indicators, right-click on the Bollinger Bands and add it to the chart.
The indicator is shown on the USD/CHF chart with red lines. As you might notice from the chart above when the prices are stable, the bands tend to be close together, however, once the prices move up, the lines, or bands, go further apart. The upper and lower bands measure the volatility of the price over time. They are mostly displayed with three lines, an upper band, a middle line, and a lower band. The middle line of the indicator is the simple moving average, and the top and bottom lines are the bands.
When it comes to MT4 Forex indicators, Bollinger Bands are among the most reliable and potent trading indicators in the market. They offer traders information about the strength of the trend, which can be used to better tell when to enter the positions.
To add it to your chart, you should go to the indicators, then MetaTrader 4 trend indicators, right-click on the Bollinger Bands and add it to the chart.
MFI
When it comes to MetaTrader 4 indicators explained, it is very important to discuss volume indicators. One of the volume indicators that are very popular among traders is the Money Flow Index, simply called MFI. This technical oscillator uses price and volume data to identify whether the market is overbought or oversold. The oscillator moves from 0 to 100 and incorporates both volume and price data. In most cases, moves below 10 and above 90 are very rare. In most cases, traders watch for MFI to move back above 10 to signal a long trade, and a drop below 90 to signal a short trade.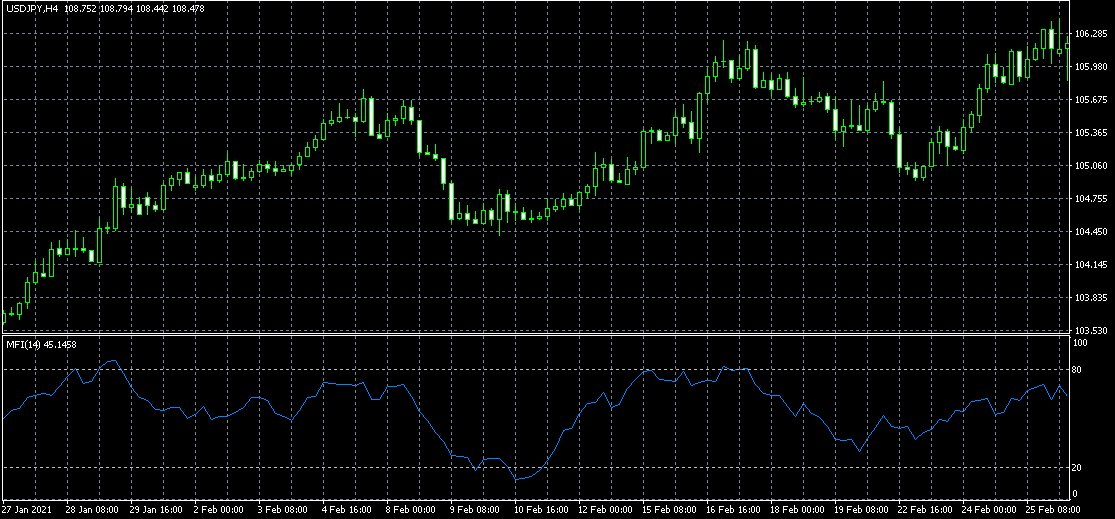 The MFI indicator above is shown on the USD/JPY candlestick chart. As you can see, the RFI is very easy to read and is applied to the chart directly.
To apply it to the chart you should go to the indicators of the MetaTrader 4, find Volumes indicators, under which, you can see Money Flow Index. By double-clicking the Money Flow Index, MF
The MFI indicator above is shown on the USD/JPY candlestick chart. As you can see, the RFI is very easy to read and is applied to the chart directly.
To apply it to the chart you should go to the indicators of the MetaTrader 4, find Volumes indicators, under which, you can see Money Flow Index. By double-clicking the Money Flow Index, MF