


 Open Live Account
 Try on Demo
 Trading Fees
 Forex
Forex EUR/USD
 USD/JPN
 USD/GBP
 CFDs on Stocks
 Apple
Apple Amazon
 Tesla
Tesla CFDs on Crypto
 USD/BTC
 USD/ETH
 JPY/BTC

- Forex trends are price movements which most traders follow
- The trend can be upward or downward
- Trends can be measured by dozens of different indicators
Forex Trend Trading Is Your Friend
You’ve probably heard of the expression “the trend is your friend until it bends”. But you might wonder whether the trend is really that important. Or is it overhyped? Although some traders believe that trends are too slow for trading decisions, most experts agree that the trend offers key information about the overall direction of the price chart. This Forex trend trading guide explains why it’s useful to trade Forex with trends and adds Forex trend trading tips. In other words, Forex trend trading is reviewed for you from A to Z. In this Forex trend trading guide, also try to share some tips on how to set up hopefully one of the best Forex trend trading strategies.What Is A Trend In Price Charts?
Trends are a form of technical analysis. They often appear on the price charts of financial instruments. Many traders focus A trend indicates that one side has been stronger than the other. There are many trend trading strategies in Forex. But first, it’s needed that Forex trend trading is explained. Basically, price movement favors one of the two directions:An Uptrend Is Bullish
- Price action was lower in the past but has been moving higher recently.
A Downtrend Is Bearish
- Price action was higher in the past but has been moving lower recently.
Uptrend
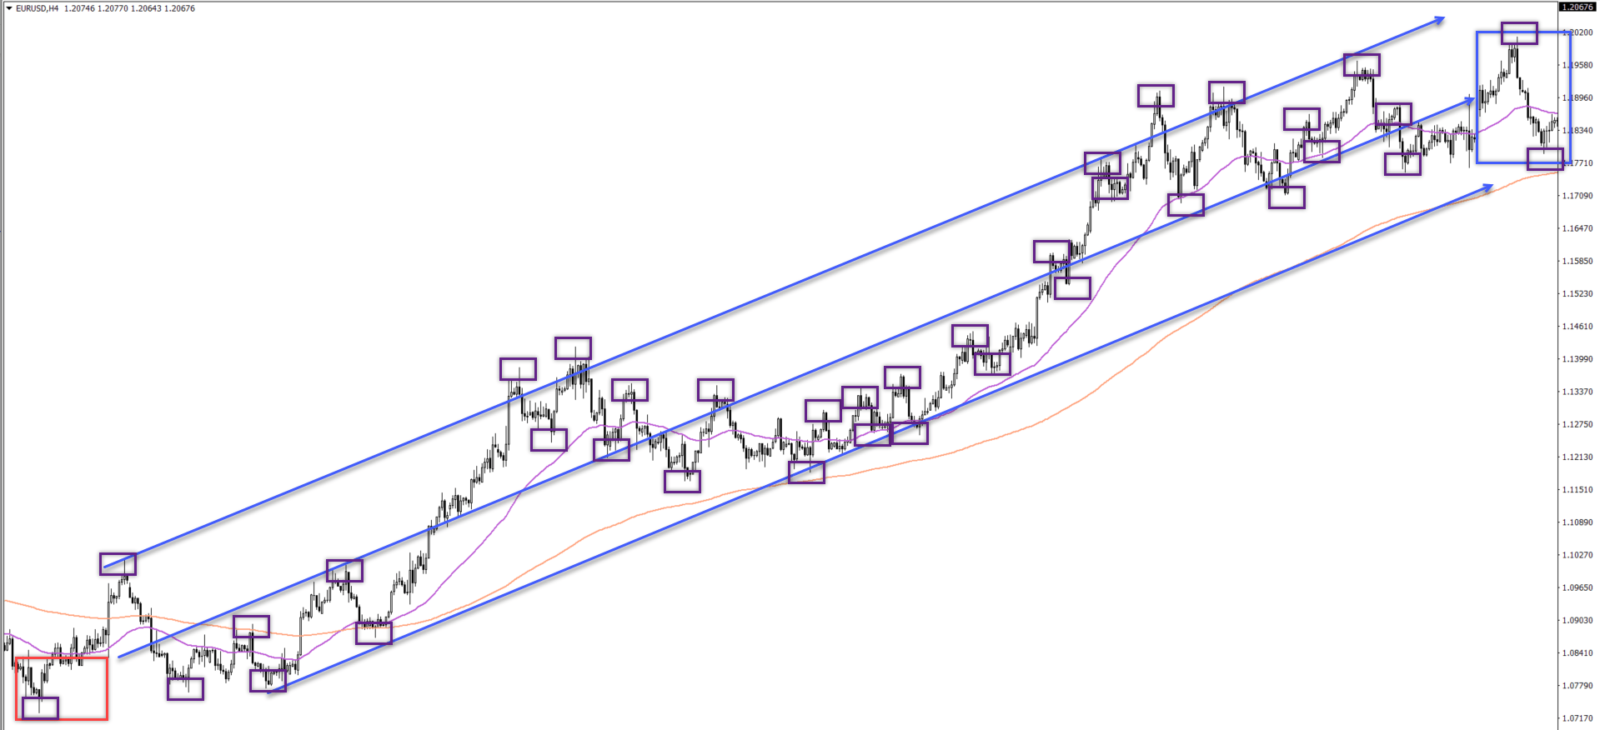
Higher lows (HL) and higher highs (HH):- See the blue arrow for the uptrend in the image below.
- Blue boxes indicate the HHs and HLs.
- Some exceptions might occur but mostly HL and HH are visible.
Downtrend
Lower highs (LH) and low lows (LL):- See the red arrow for the downtrend in the image below.
- Red boxes indicate the LLs and LHs.
- Some exceptions might occur but mostly LL and LH are visible.
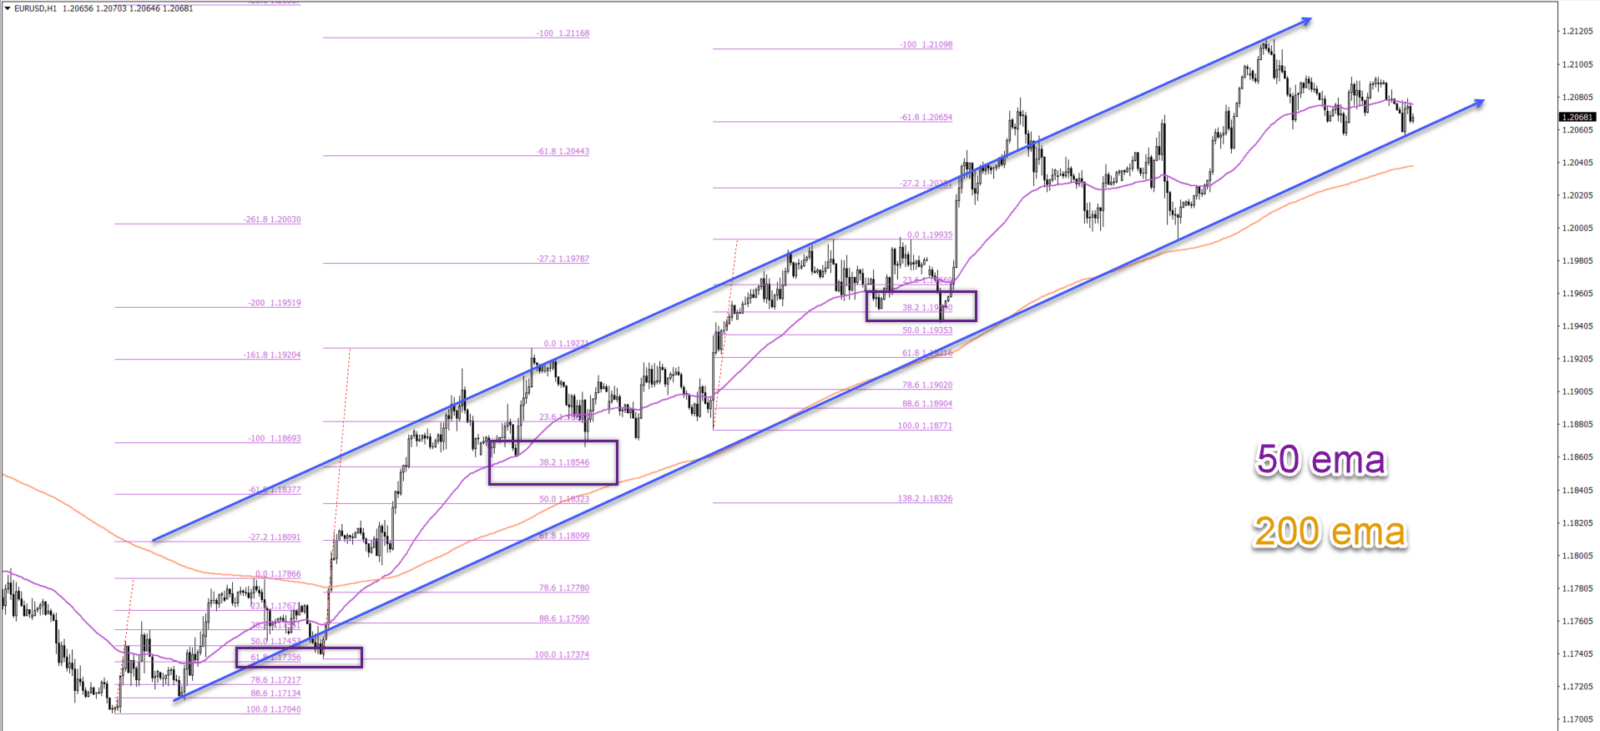
 Usually, traders analyze trends on a one-time frame higher than their entry time frame. For instance, a trader using the 1-hour chart for entries often uses the 4-hour chart for determining the best forex trend trading strategy.
There is no fixed rule for trends and any time frame can be used for spotting the trend. Just keep in mind that trends on higher time frames are typically seen as stronger.
Using trends allows traders to better understand charts and improve their trading decisions. Let’s now discuss the main benefits of Forex trend trading strategy.
Usually, traders analyze trends on a one-time frame higher than their entry time frame. For instance, a trader using the 1-hour chart for entries often uses the 4-hour chart for determining the best forex trend trading strategy.
There is no fixed rule for trends and any time frame can be used for spotting the trend. Just keep in mind that trends on higher time frames are typically seen as stronger.
Using trends allows traders to better understand charts and improve their trading decisions. Let’s now discuss the main benefits of Forex trend trading strategy.
What Value Does Trend Trading Forex Offer?
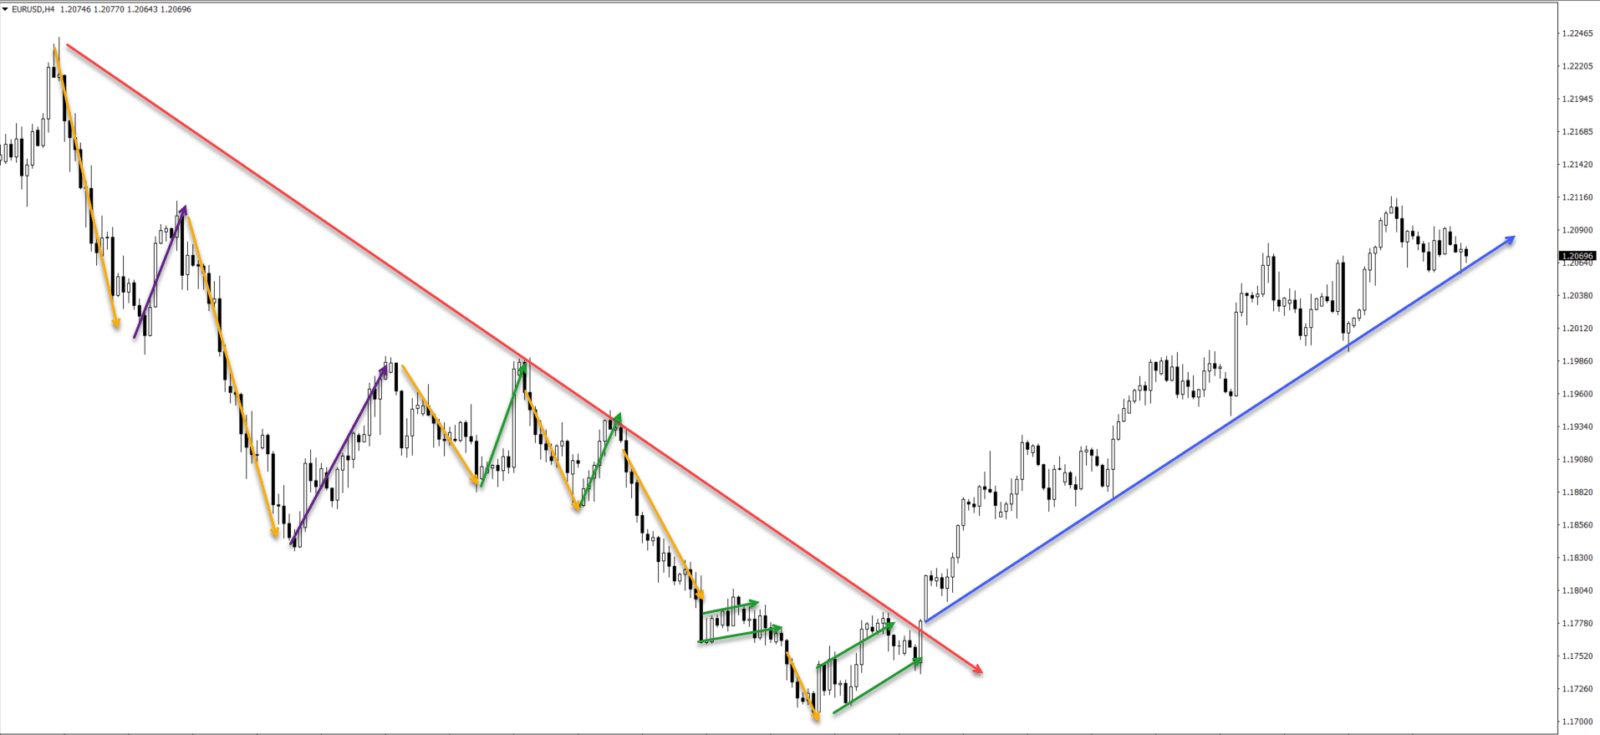
The trend offers multiple benefits for trading price charts: The trend offers various phases and can be split into different cycles:- There is a trending phase (orange arrows in the image below) when the price action moves with the trend (red arrow).
- There is a pullback phase when the price action goes mildly against the trend (green arrows).
- There is a retracement phase when the price action goes stronger against the trend (purple arrows).
- There is a reversal phase when the price action goes fully against the trend and the old trend is finished (blue arrow).
- Then there are moments when no trend is visible and price action is in a range or consolidation.
 Forex Trend Trading Offers Discounts:
- Why? The trend moves up or down in phases. This means that pullbacks and corrections are common and visible within a trend (see point 1).
- These pullbacks offer a discount to traders.
- This means that traders are able to join the trend at a better price level.
- A trend has a high chance of continuing due to market psychology.
- Market cycles tend to repeat. Why? Because after traders see a pullback, they buy or sell with the trend to receive their discount (see point 2). These trades push the trend again in the same direction.
 Traders Can Avoid Weak Setups Against The Trend:
- Some setups might look good but not anymore if traders consider the direction of the trend.
- Keeping an eye on the trend can help avoid weaker setups and is an excellent filter.
- The trend is not the only important aspect of technical analysis. But it is critical to combine the trend with support and resistance and price patterns.
What Are The Best Forex Trend Trading Tools For Price Charts?
There are many different methods for analyzing the trend. This article will focus on a couple of methods that offer quick and simple help. Let’s start with the simplest ideas and gradually move to more complex methods:-
Compare The Right With The Left Side Of The Price Charts.
-
Use Higher Highs And Higher Lows And Lower Lows And Lower Highs.