


 Open Live Account
 Try on Demo
 Trading Fees
 Forex
Forex EUR/USD
 USD/JPN
 USD/GBP
 CFDs on Stocks
 Apple
Apple Amazon
 Tesla
Tesla CFDs on Crypto
 USD/BTC
 USD/ETH
 JPY/BTC

- A breakout is when a pair's price goes beyond the anticipated level
- A fakeout is when a pair's price looks like it's going to break out, but corrects at the very end
Forex Trading Breakouts And Fakeouts
Did you ever try to trade breakouts and fakeouts in Forex but then see price action do the opposite? Or perhaps you tried to trade a false break (“fakeout”) but only to see the original break succeed. Deciding what is a breakout and what is a fakeout can be tricky. And traders often run into losses when trading them. But there is good news: traders can improve their track record by using indicators, candlesticks, and price patterns. This article explains how traders can use these techniques to focus on the setups with the best chances. It also explains how you can try to avoid weaker setups.What Are Breakouts And Fakeouts?
The terms breakouts and fakeouts in Forex are part of technical analysis, which studies price past and current movements on the charts of financial markets. The goal is to focus on trade setups that offer the best odds and expected profitability in the long term. Let’s review these concepts first. This part will review the breakouts and fakeouts definition, breakout and fakeout meaning, breakout and fakeout difference, and breakout and fakeout examples. Trading breakouts and fakeouts explained:- Breakouts: occur when price action is pushing or breaking through a support or resistance (S&R) level or zone. The term breakout can refer to a future or upcoming breakout, or one that is taking place right now, or one that has already occurred in the past.
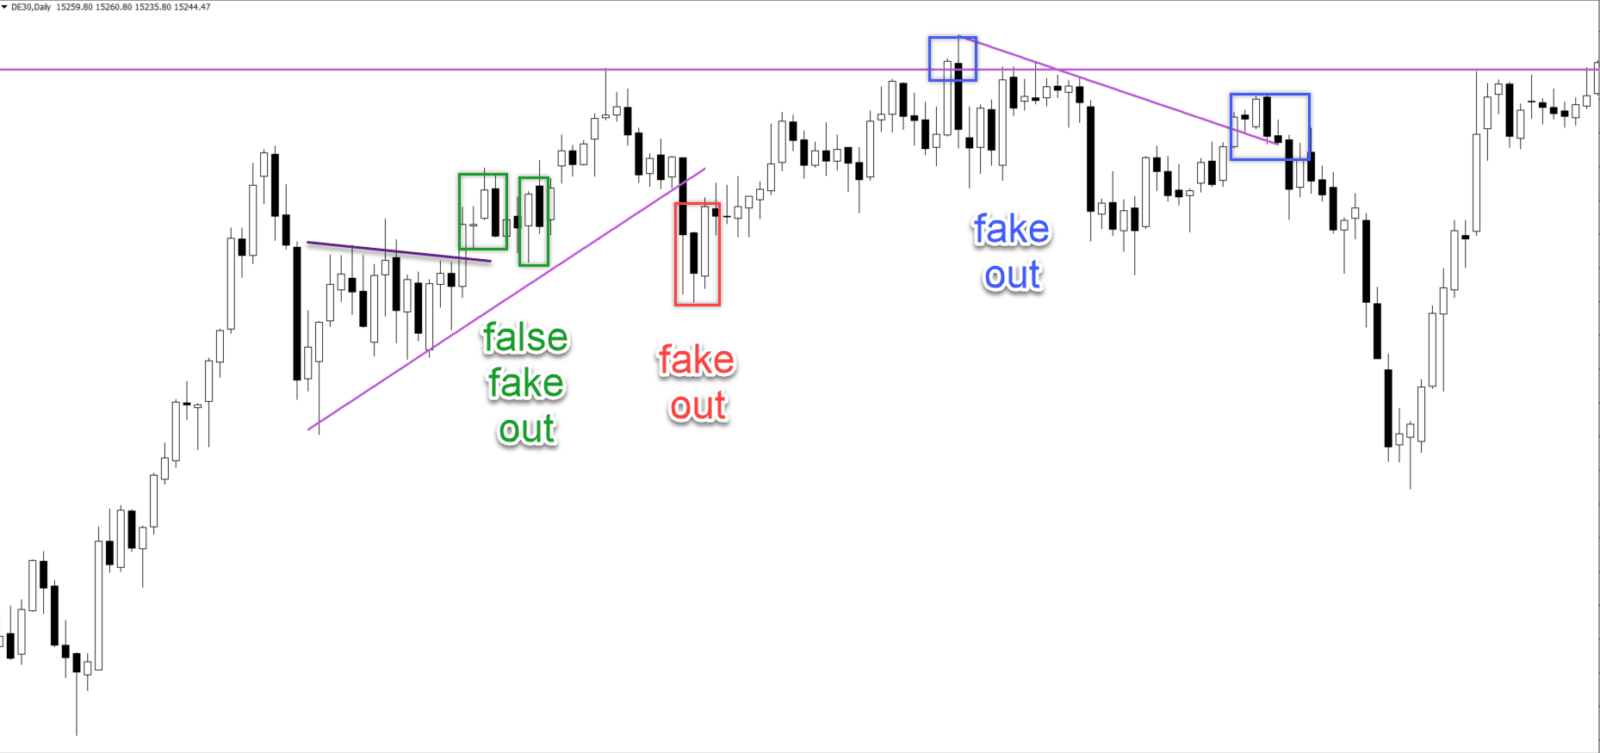
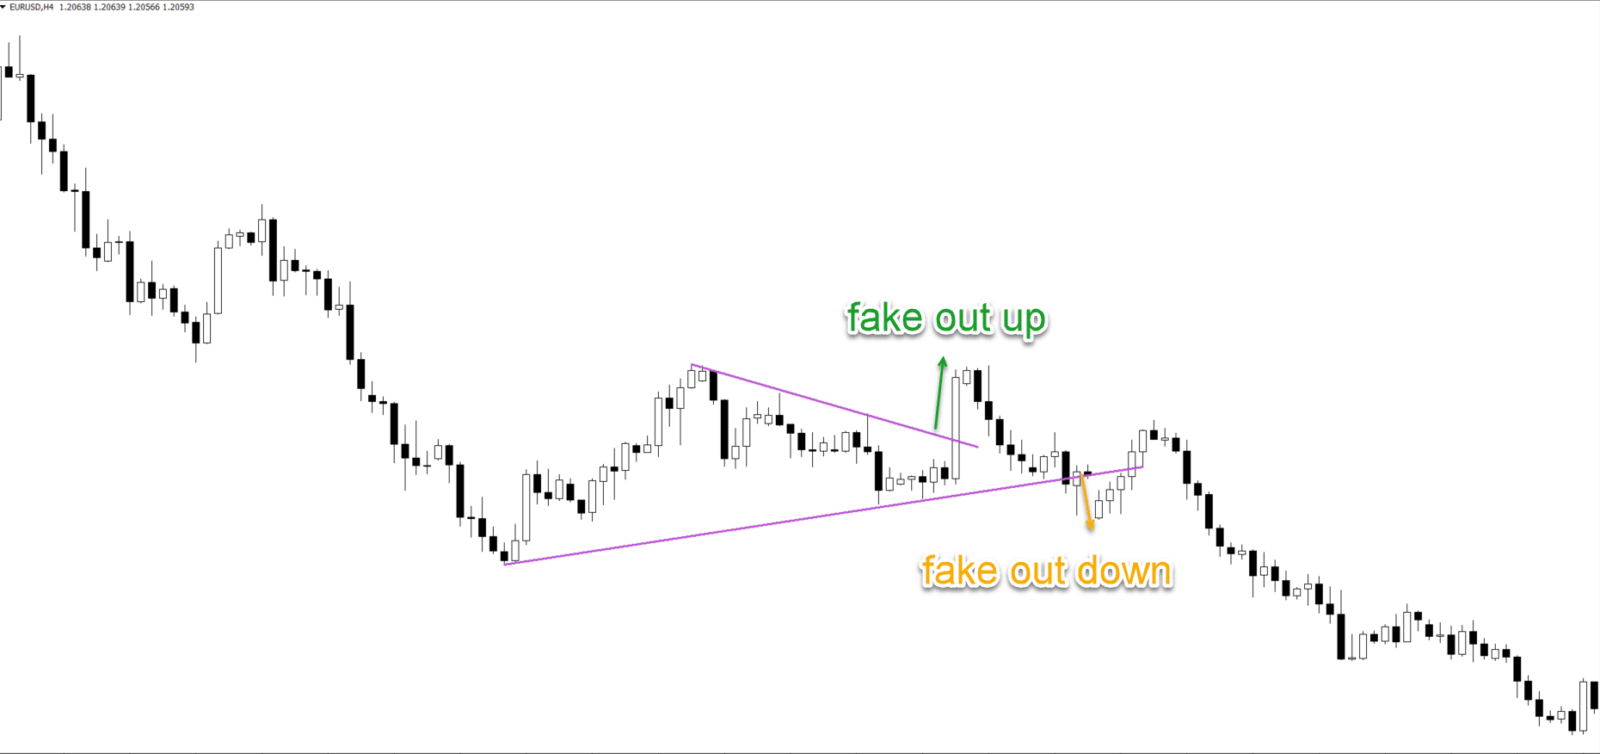
- Fakeouts: occur when price action has broken through a support or resistance level but price action fails to continue with the breakout direction and reverses in the opposite direction.
- False fakeouts: are breakouts that seem to fail and look like a fakeout. But then price action still successfully manages to move into the original direction of the breakout.
How Do You Measure Breakout vs Fakeout?
Breakouts and fakeouts in Forex are important because they occur regularly. Although these 3 concepts (breakout, fakeouts, and false fakeouts) may seem confusing to traders at first. Let’s step by step analyze Forex trading breakouts and fakeouts. First, before trading breakouts and fakeouts, it’s key to focus on finding the breakouts and fakeouts first. The first thing a trader needs to do is identify key support and resistance levels. Support and resistance is a price level that has stopped or can stop price from moving in that direction.- Falling prices can bounce at support or break below it.
- Rising prices can bounce at resistance or break above it.
 Thirdly, a breakout occurs when price action is about to break, is breaking through, or has broken through the S&R level. A trader can decide themselves at what stage to trade the breakout - if at all.
- Strong candles that are approaching an S&R level could be a clue that a breakout is near.
- It also helps the breakout chances if price action is approaching the S&R level multiple times.
- A candle close above the resistance or below the support could confirm the breakout.
- A candle close near the high for a bullish break and near the low for a bearish breakout often indicates that the breakout is in control.
 Fourthly, if price action fails to confirm the breakout, then price action could be making a fakeout.
- A candle closes far away from the high (for a bullish breakout) or from the low (for a bearish breakout) indicates weakness and a potential fakeout.
- Candle wicks also indicate a lack of strength for the breakout.
- Large-sized candles in the opposite direction of the breakout also could indicate a fakeout.
8 Techniques For Trading Breakout And Fakeout Setups
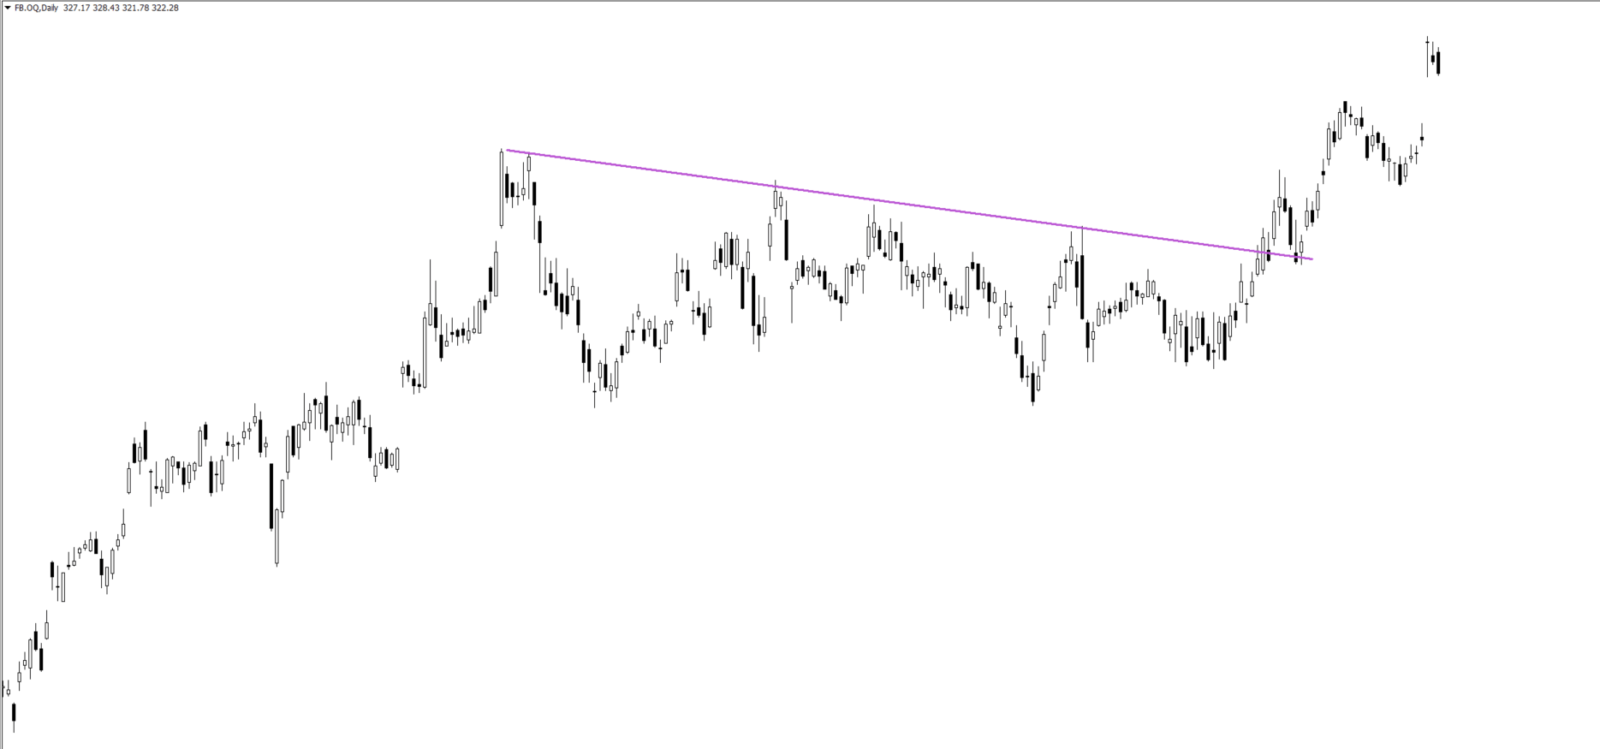
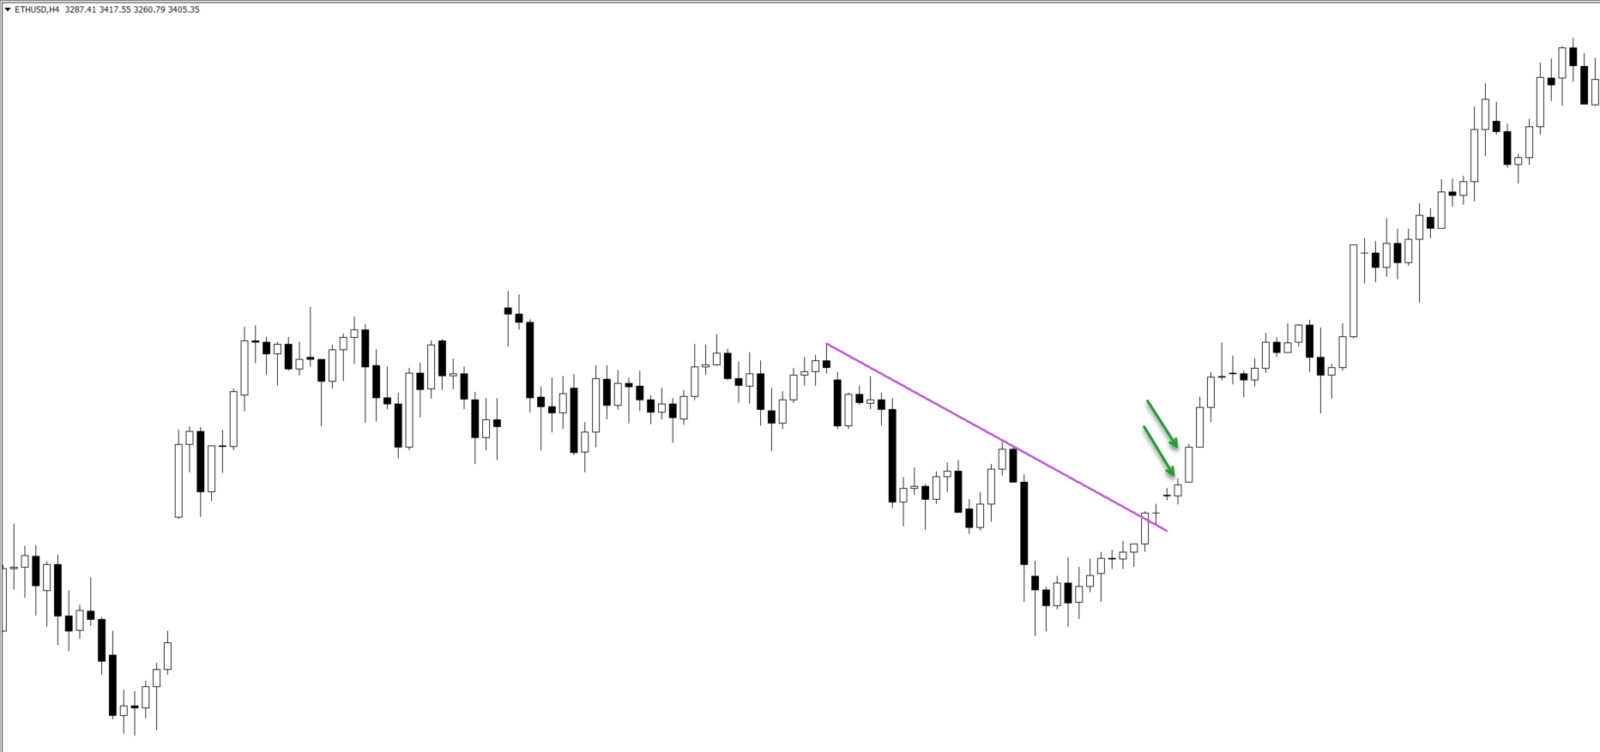
This article mentioned that traders can improve their track record by using indicators, candlesticks, and price patterns. Trading breakouts and fakeouts in Forex can be tricky. With these tools, understanding and finding breakouts and fakeouts are simplified. Here are some charting tools that can help:- Trend lines for spotting breakouts. Trend lines require some patience and experience, but they offer a useful short-cut for spotting moments when price action is pushing through a key level.
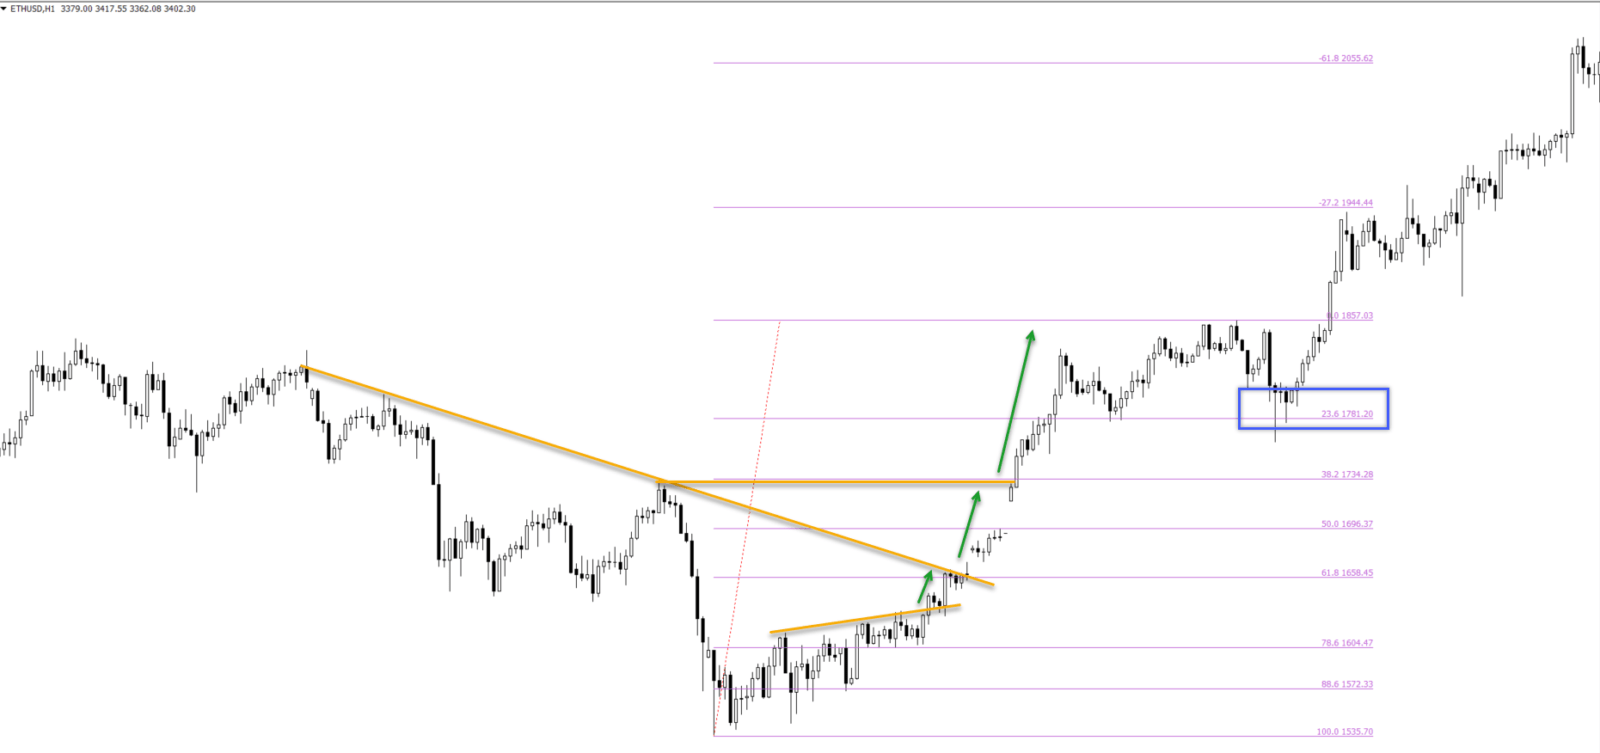
- Fibonacci levels for pullbacks. If the breakout is strong enough, then a pullback should find support at the Fibonacci levels for a bounce and continuation. A bounce at a Fib level could indicate that the breakout is not weak.
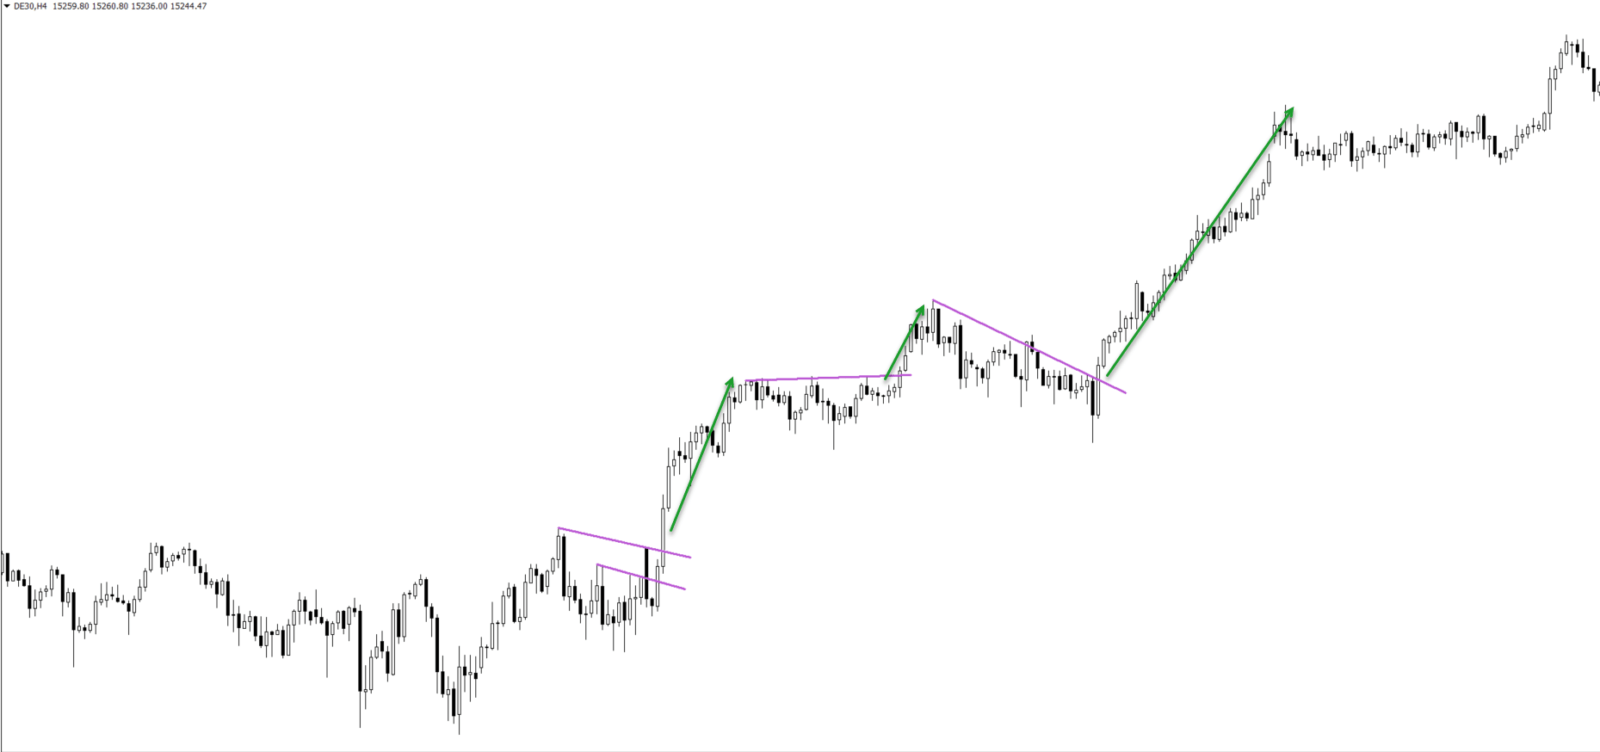
- Chart patterns for indecision. Once chart patterns (green lines in the image below) emerge after the breakout, then this often indicates that there is no significant pressure or price movement against the breakout direction. Contracting triangles and flag patterns are usually interesting chart patterns after breakouts. A chart pattern could emerge on the current time frame or even one time frame lower.
- Strong candlestick pattern on a higher time frame. Not sure if the breakout