


 Open Live Account
 Try on Demo
 Trading Fees
 Forex
Forex EUR/USD
 USD/JPN
 USD/GBP
 CFDs on Stocks
 Apple
Apple Amazon
 Tesla
Tesla CFDs on Crypto
 USD/BTC
 USD/ETH
 JPY/BTC

- Forex fractal indicators show you the resistance and support levels on the price chart.
- Resistance fractal shows up on top of the candlestick, and support shows up below it
- Long and short setups are the best fractal indicator strategies
Fractal Indicator Forex - What Is It And How Does It Work
The Fractal is an indicator that shows support and resistance on a price chart. The indicator is used in technical analysis to understand and analyze price movements in the financial markets. The fractals indicator in Forex uses the same logic as the Fractal indicator with stock charts.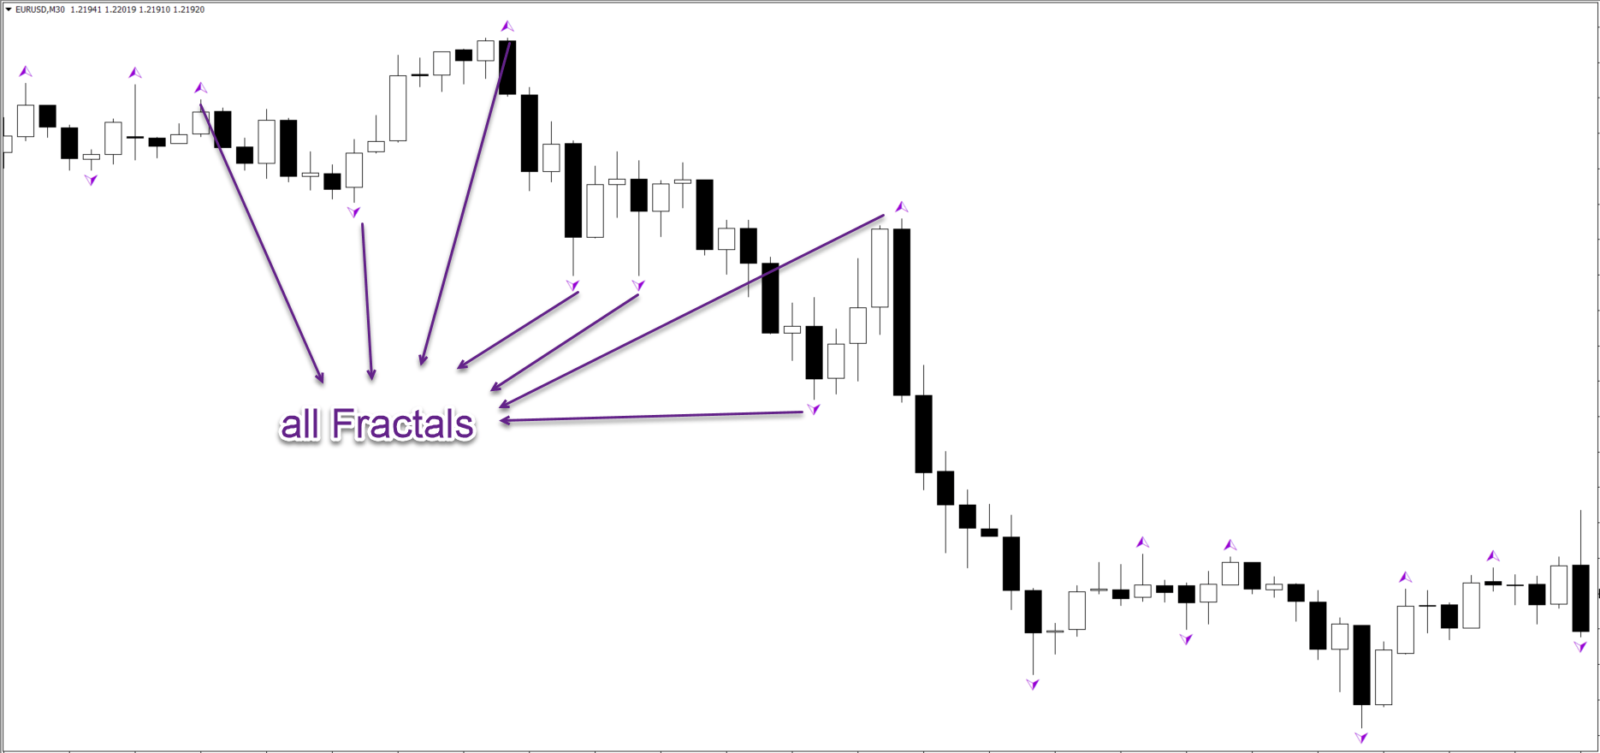 Support and resistance levels offer useful information for any financial instrument. Traders can analyze price charts by combining trend and momentum, price patterns, and support and resistance.
How Does The Fractal Indicator Forex Show Support And Resistance Levels?
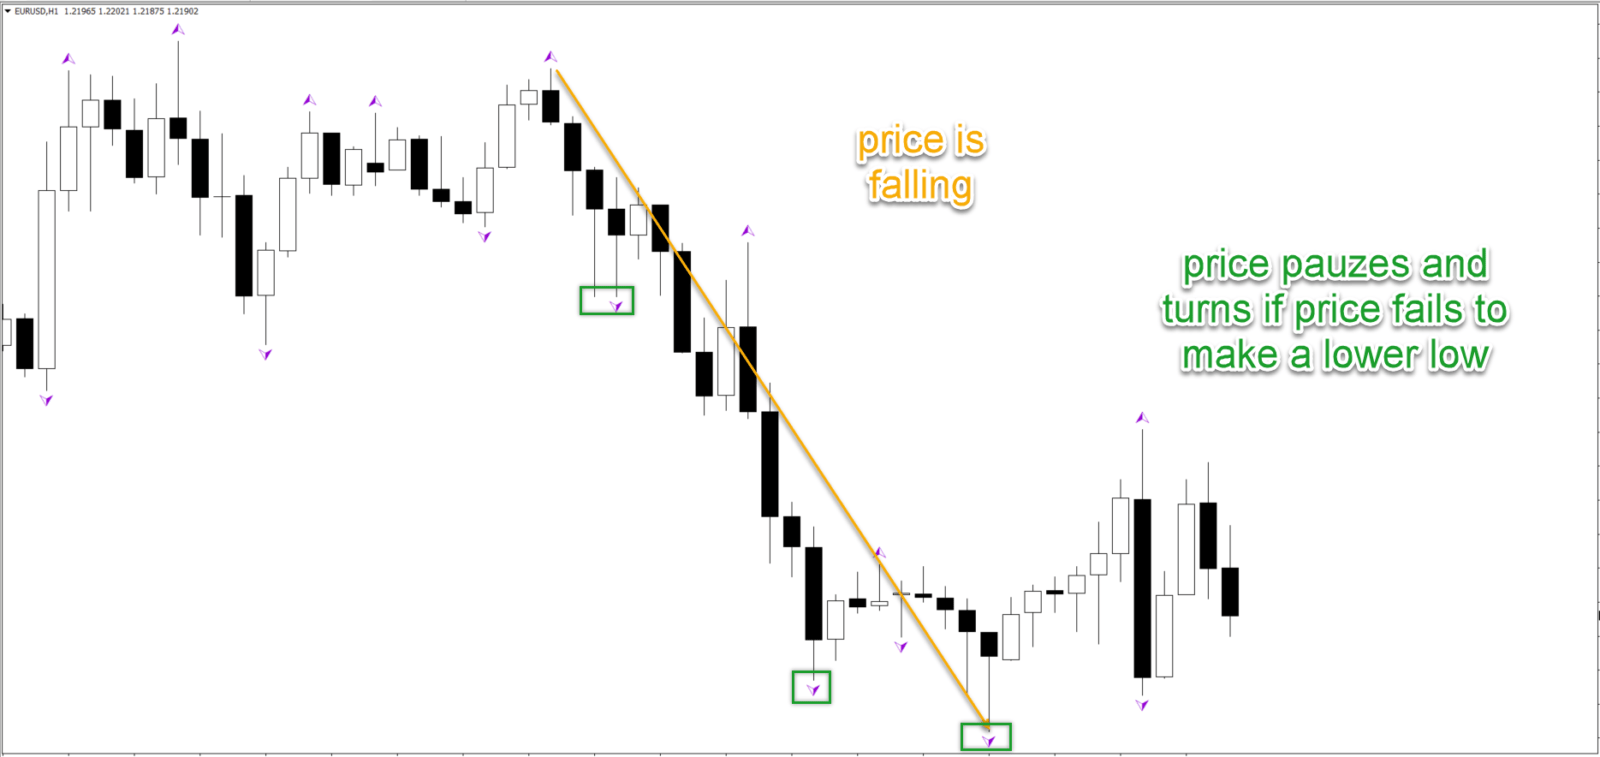
Simply said, a Fractal appears when price action makes a pivot (turn) or a simple pause in the other direction. The place where price action made the turn or pause becomes a support or resistance level. How does price action make a pivot? A Fractal appears on the chart when price action fails to break above a candle high or candle low within a certain time limit (explained in the 3 steps later in this paragraph).
The idea is that once price action is unable to break for a higher high or lower low, then price action is running out of steam and creating a turning point (called Fractal). This turning point becomes a support and resistance level.
If price action keeps pushing for a higher high without a significant pause, then the market is in an impulse. Once the impulse is over, then the Fractal will appear to indicate the start of a potential correction or retracement.
How does price action make a pivot? A Fractal appears on the chart when price action fails to break above a candle high or candle low within a certain time limit (explained in the 3 steps later in this paragraph).
The idea is that once price action is unable to break for a higher high or lower low, then price action is running out of steam and creating a turning point (called Fractal). This turning point becomes a support and resistance level.
If price action keeps pushing for a higher high without a significant pause, then the market is in an impulse. Once the impulse is over, then the Fractal will appear to indicate the start of a potential correction or retracement.
 Here is how Fractal trading Forex works:
- Resistance Fractal: a resistance Fractal appears above the candlestick if a candle high has a high that is higher than at least two candles to the left and two candles to the right. This is a minimum and there is no maximum. So more candles to the left and/or the right of it is acceptable.
- Support Fractal: a support Fractal appears below the candlestick if a candle low has a low that is lower than at least two candles to the left and two candles to the right. This is a minimum, so more candles to the left and/or the right of it is acceptable.
- The support and resistance level is not where the Fractal is shown on the chart. The actual support and resistance level is the candle low and/or candle high itself with candlesticks that have a Fractal.
 Once there are two candles to the left and to the right that qualify, then the candles need to be close to confirm the Fractal. Once the candlesticks are closed, then the Fractal will always remain on the chart (and never disappear).
This logic is valid on all time frames and financial instruments. For instance, the Fractals indicator in Forex is using the same logic as Fractals in the stock market.
The Fractal indicator is a standard indicator on the MetaTrader 4 platform (MT4). Although some traders ask what is the best fractal Forex indicator, in reality, the differences are small and all Fractal indicators show the same levels.
This part discussed how the Fractal indicator Forex works. Now it is time to explain how to use the Forex fractals indicator MT4.
Once there are two candles to the left and to the right that qualify, then the candles need to be close to confirm the Fractal. Once the candlesticks are closed, then the Fractal will always remain on the chart (and never disappear).
This logic is valid on all time frames and financial instruments. For instance, the Fractals indicator in Forex is using the same logic as Fractals in the stock market.
The Fractal indicator is a standard indicator on the MetaTrader 4 platform (MT4). Although some traders ask what is the best fractal Forex indicator, in reality, the differences are small and all Fractal indicators show the same levels.
This part discussed how the Fractal indicator Forex works. Now it is time to explain how to use the Forex fractals indicator MT4.
Fractal Breakout Indicator Forex
The main aspect to remember is simple: the Fractal indicator shows key support and resistance levels on any price chart and any time frame. These support and resistance levels can be used as all other support and resistance indicators: for breakouts, bounces, targets, stop losses, and entries.Using Fractal Indicator Forex For Breakouts And Bounces
The Fractal indicator is most known as a breakout indicator. When you look at Fractals trading in for instance Forex Factory, you will notice that most are using the Fractal for breakouts. These Fractal levels are used as support and resistance levels. A breakout takes place once price action breaks above the resistance of the Fractal or below the support of the Fractal.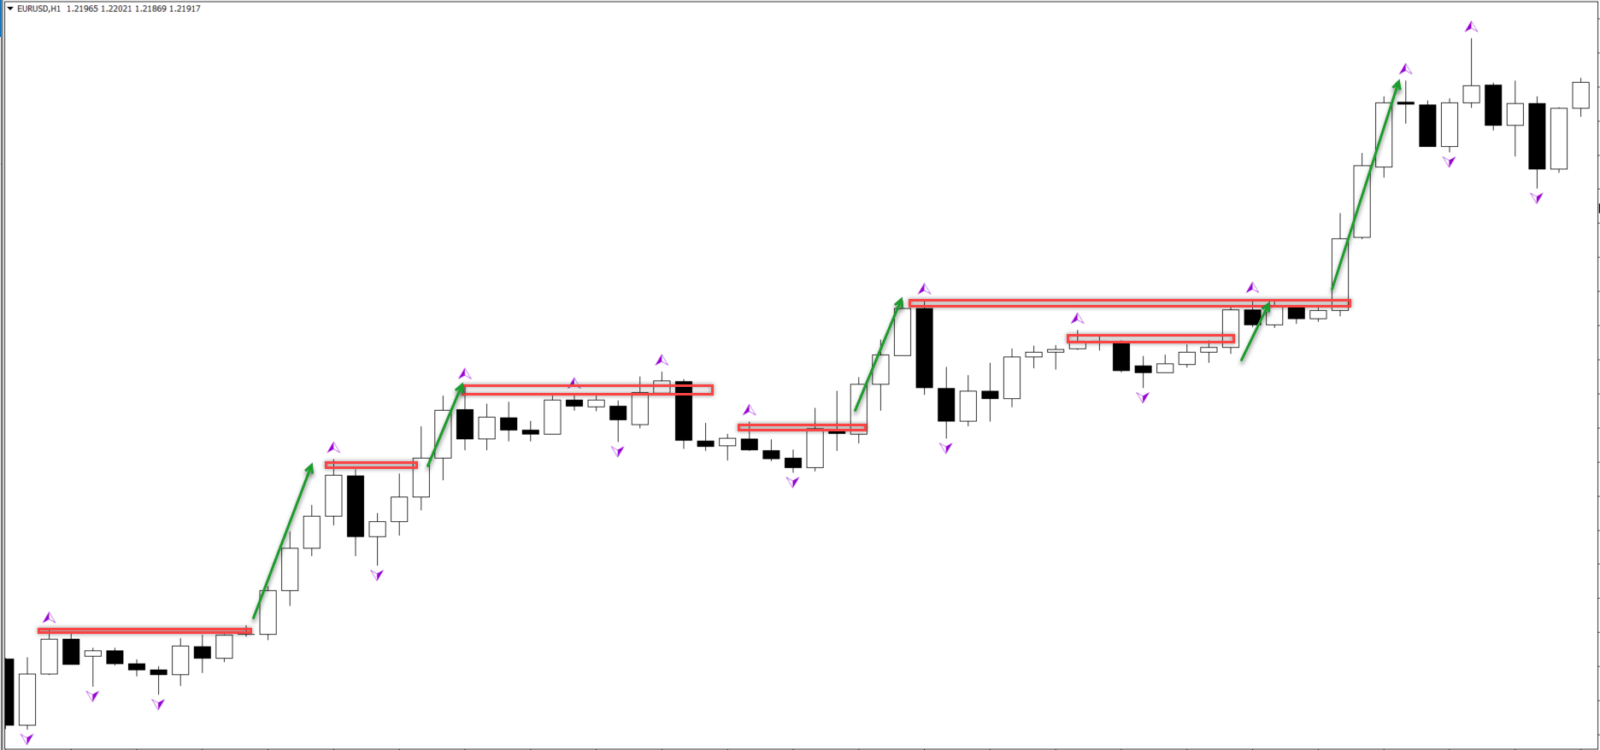 The Fractal indicator can also be used as a bounce indicator. Once price action fails to break above the resistance or below the support, a reversal or bounce could take place.
 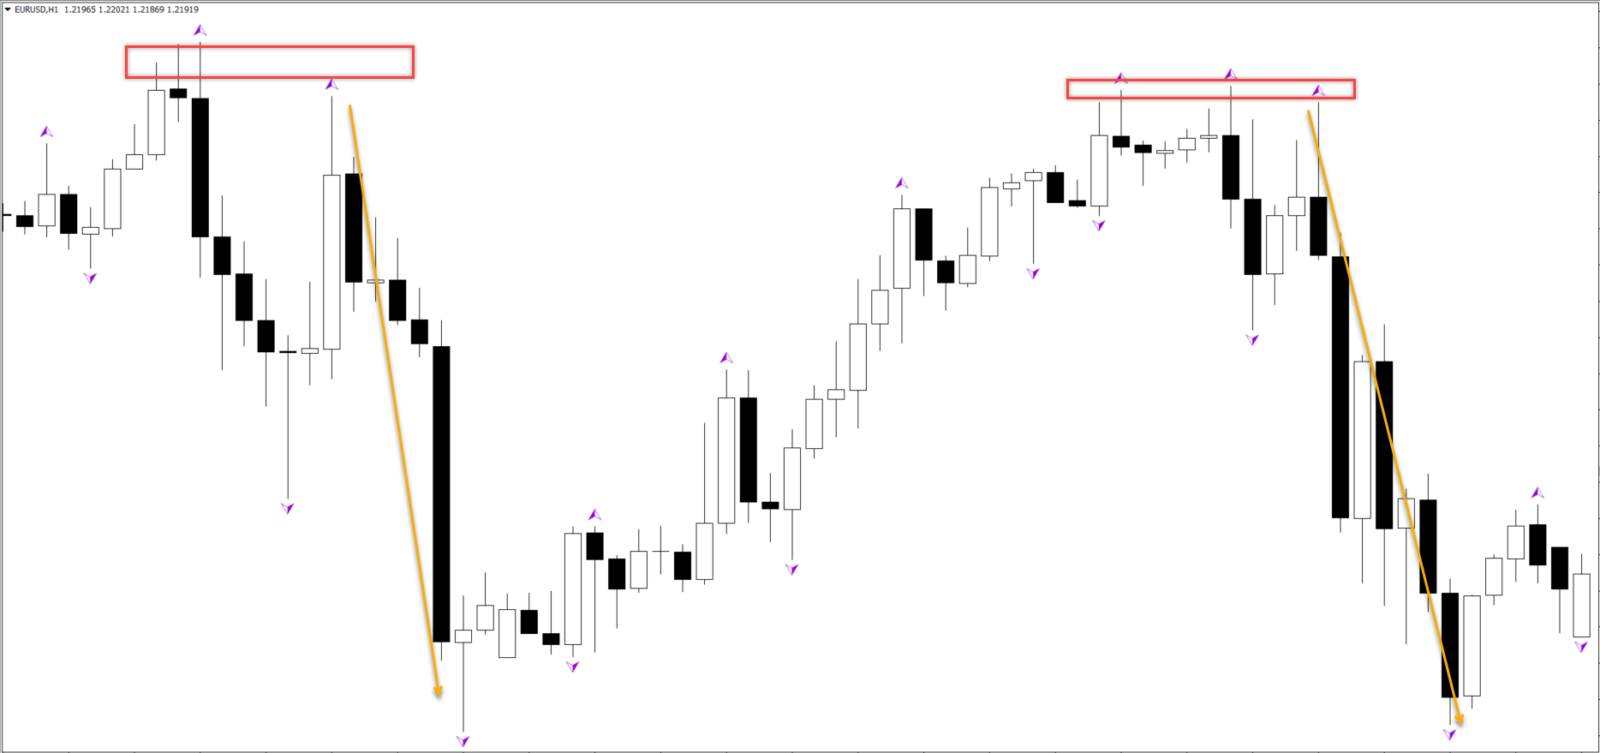 It is important to analyze whether a breakout or bounce is expected. Traders can use other tools and indicators to complete their analysis. Or they can use a trading strategy to improve their trading decisions.
The Fractal indicator itself will not inform traders whether price action will break or bounce, it will only show the support and resistance levels themselves. Most traders use the Fractal indicator for trading with the trend or a reversal (but only if there is a very chance that a reversal will occur).
It is important to analyze whether a breakout or bounce is expected. Traders can use other tools and indicators to complete their analysis. Or they can use a trading strategy to improve their trading decisions.
The Fractal indicator itself will not inform traders whether price action will break or bounce, it will only show the support and resistance levels themselves. Most traders use the Fractal indicator for trading with the trend or a reversal (but only if there is a very chance that a reversal will occur).
Using Forex Fractal Indicator For Targets And Stop Losses
A Fractal indicator is support and/or resistance level. These levels are therefore quite useful for placing a stop loss:- With long setups: traders can place the stop loss below the support Fractal.
- With short setups: traders can place the stop loss above the resistance Fractal.
- With long setups: traders can aim at the Fractal resistance on higher time frames.
- With short setups: traders can aim at the Fractal support on higher time frames.

Fractal Indicator Strategy - What's The Best One?
The main Fractal indicator strategy is based on entries based on a breakout:- Long setups: a pending order above the resistance Fractal.
- Short setups: a pending order below the support Fractal.