


 Open Live Account
 Try on Demo
 Trading Fees
 Forex
Forex EUR/USD
 USD/JPN
 USD/GBP
 CFDs on Stocks
 Apple
Apple Amazon
 Tesla
Tesla CFDs on Crypto
 USD/BTC
 USD/ETH
 JPY/BTC

- Elliott Wave analyzes recurring long-term price movements
- It looks at two phases: the motive phase and the corrective phase
- It's usually used to spot price waves
Understanding Elliott Waves With Moving Averages
Are you sometimes confused by how the price moves continuously up and down? Or perhaps you wonder whether there is a method that allows you to analyze them? It may seem that the price movements up and down are random. But not to traders using the Elliott Wave Theory (EWT) for analyzing price charts… Because the Elliott Wave explains how the price moves in sync with market psychology. This article explains how to understand moving averages plus how Elliott Waves and moving averages work together. Moreover, it also shares how traders can use a simple method based on moving averages to simplify their wave analysis. Traders will understand how moving averages work, how to combine Elliott Waves with moving averages, and how to do EW analysis with moving averages (ew moving average).What Is The Elliott Wave Theory?
The Elliott Wave Theory is a method for analysts to understand the price movements on the price charts. It is a form of technical analysis. Traders can use the Elliott Waves to understand the price patterns behind the price movements. Price moves in waves and cycles which are based on investor psychology.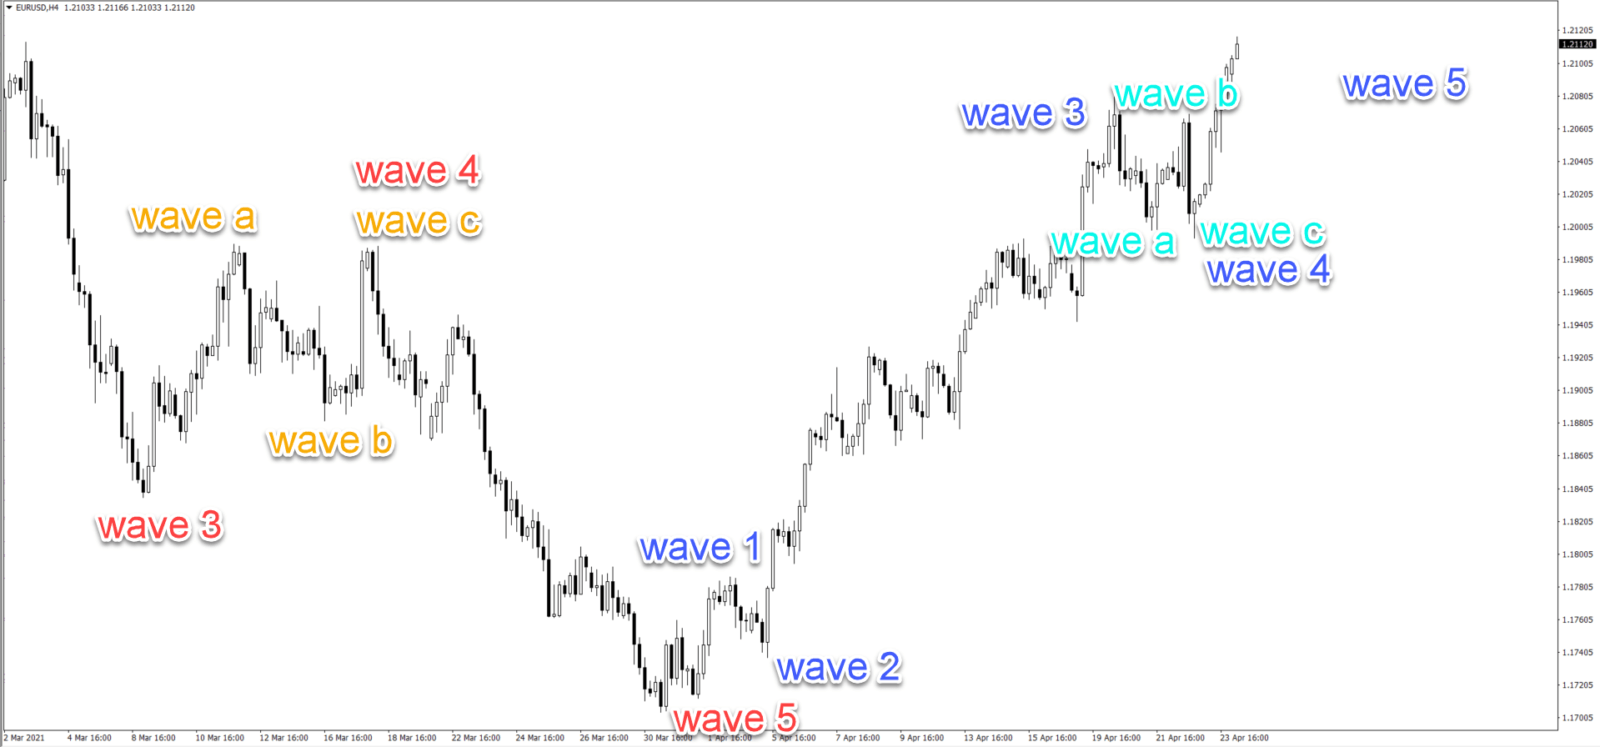 Once you understand these price patterns, then you will be able to:
- Identify them on the price chart and use them for making forecasts.
- Use these predictions to focus on the trading opportunities that offer the best edge.
- Better understand the price charts and their movements.
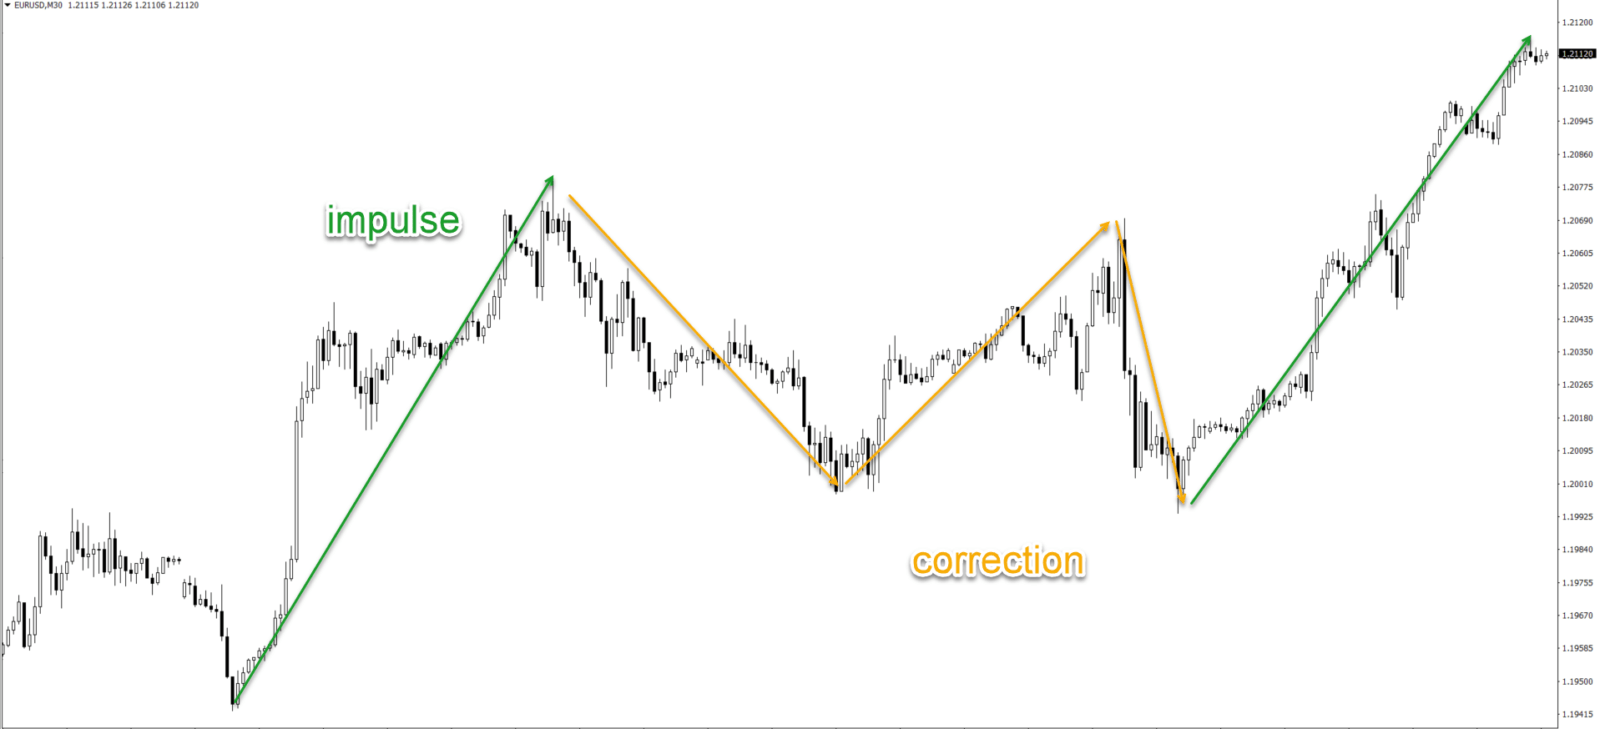
- Motive phase:
Also known as momentum, impulse, or impulsive price swing.
- The impulsive price swing is with the trend move - up or down.
- Impulsive price action is subdivided into 5 waves (12345) to a lower degree.
- Waves 1, 3, and 5 are impulsive.
- Waves 2 and 4 are corrective.
- Corrective phase:
Also known as a correction, retrace, pullback, or corrective price swing.
- The corrective price swing is a counter-trend move - up or down.
- Corrective price action is subdivided into 3 waves (ABC) to a lower degree.
- Waves A and C are impulsive or corrective.
- Wave B is corrective.
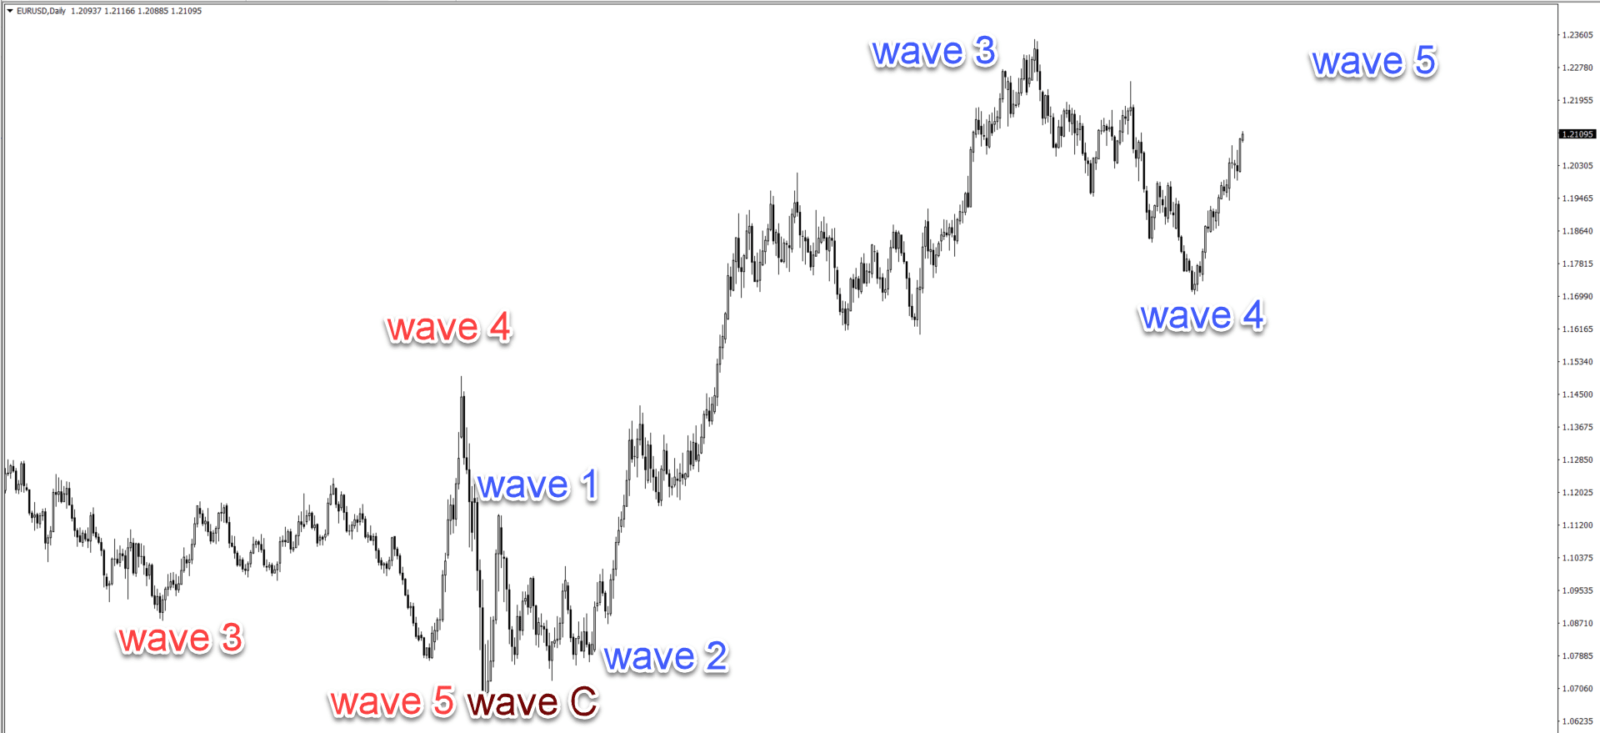
 These motive and corrective phases occur on all time frames, instruments, and across all time periods (in the past and now).
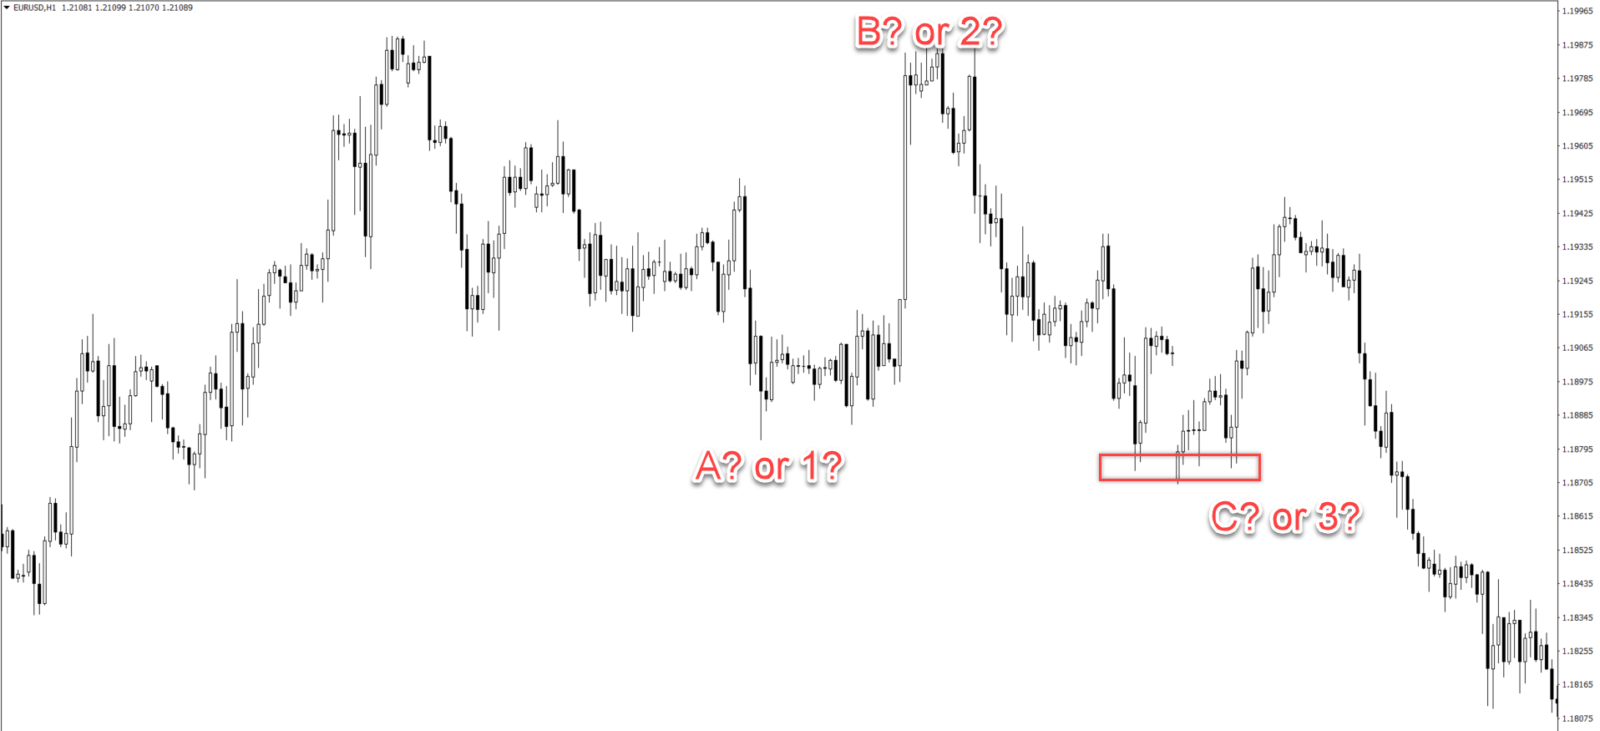
The 5 motive and 3 corrective waves are part of a higher degree as well. They could form a wave 1 and wave 2 on the higher time frames - see image below. This is Elliott Waves explained in its simplest form.
These motive and corrective phases occur on all time frames, instruments, and across all time periods (in the past and now).
The 5 motive and 3 corrective waves are part of a higher degree as well. They could form a wave 1 and wave 2 on the higher time frames - see image below. This is Elliott Waves explained in its simplest form.
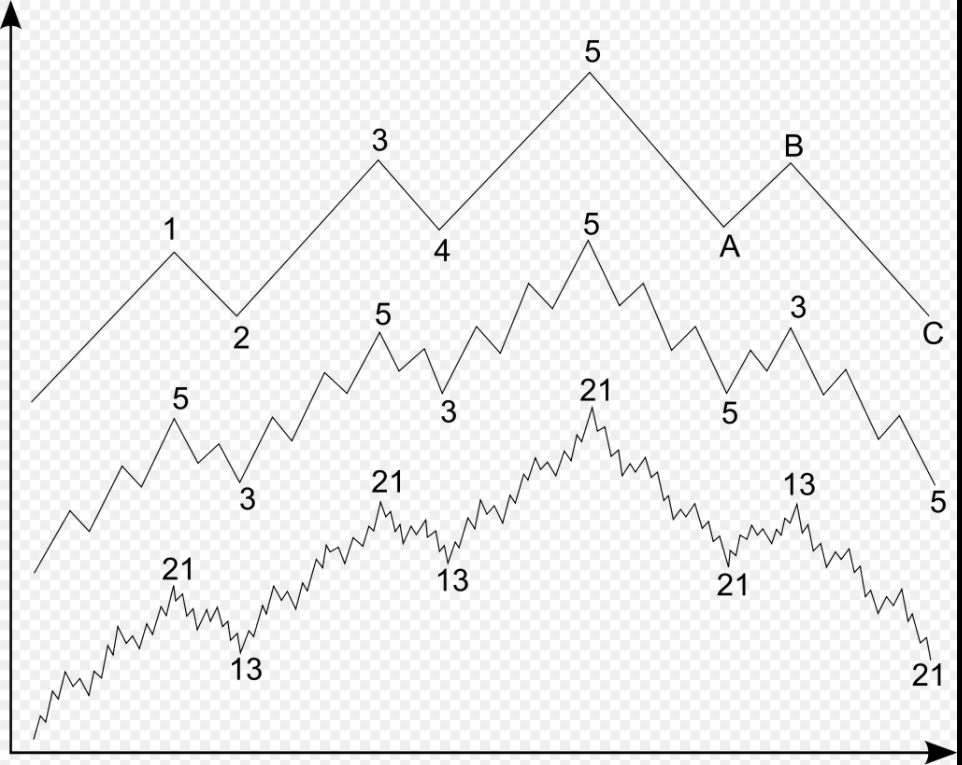 From R.N. Elliott's essay, "The Basis of the Wave Principle", October 1940.
What Are The Pros And Cons Of Elliott Wave Theory?
There are many advantages of using the Elliott Wave Theory but also some drawbacks. Let’s start with the positives:- Knowing and spotting price swings:
Traders can analyze price charts and estimate the current Elliott Wave patterns. Based on this wave analysis, they can then evaluate the character, direction, and length of:
- Previous price swings.
- The current price swing.
- The next price swing.
- Future price swings.
- Seeing the big picture: Traders can understand the price charts and understand the ‘story’ of price in more detail. They can also understand how the story is developing on multiple time frames and how those time frames connect.
- Improving your trading:
Traders can analyze which trading ideas have better probabilities and which ones have worse odds:
- A short signal from your trading system when the price patterns are showing a bearish ABC pattern in a bullish wave 2 might be a bad idea.
- But a long signal in such a case would be good.
- Using the rules and guidelines:
There are rules and guidelines available that make it easier to understand the Elliott Wave Theory. With the help of the Elliott Wave rules and guidelines, traders can get guidance from past examples and improve their ability to analyse waves correctly.
- There are 3 rules with a long list of guidelines. Let’s summarize the 3 main rules as the guidelines are outside of the scope of today’s article:
- Rule 1: wave 3 may never be the shortest.
- Rule 2: wave 2 may not break the starting point of wave 1.
- Rule 3: wave 4 may not enter the same price zone as wave 1.
- Learning waves is easier with price swings:
The main tool for analyzing wave patterns is price swings. Once you are able to recognize price swings, then you are in a much better position to see wave patterns.
- The best way to learn how to trade waves is to take it step by step.
- First, learn price swings and price patterns.
- Then focus on translating those price swings into waves.
- Then start using the waves for trading ideas.
 Both problems can be solved by simplifying the process. This can be done by using moving averages, which is what is explained in the next paragraph.
Of course, traders should also understand that using wave patterns requires some experience first. Just like learning any skill.
But using the moving averages will:
Both problems can be solved by simplifying the process. This can be done by using moving averages, which is what is explained in the next paragraph.
Of course, traders should also understand that using wave patterns requires some experience first. Just like learning any skill.
But using the moving averages will:
- Reduce the guesswork.
- Make the wave analysis more