


 Open Live Account
 Try on Demo
 Trading Fees
 Forex
Forex EUR/USD
 USD/JPN
 USD/GBP
 CFDs on Stocks
 Apple
Apple Amazon
 Tesla
Tesla CFDs on Crypto
 USD/BTC
 USD/ETH
 JPY/BTC

- A pattern seen through the average between highs and lows of a pair's price is called a moving average
- The Fibonacci tool is a method used by traders to pinpoint great entry and exit points for trades
- A fractal in forex is a recurring trend that can easily be seen on the chart
Does Adding Price Indicators Confuse You?
Do you also feel that using price indicators on your charts can quickly become confusing? Or do you notice that the more indicators you add, the more you notice paralysis of analysis? This process is logical and normal. Price indicators offer a lot of useful information, but adding too many can become counter-productive. This article explains how to balance your analysis by choosing a moderate dose of indicators. We give a practical example of how that can be done with 3 indicators: the moving averages, the Fibonacci tool, and the Fractal indicator.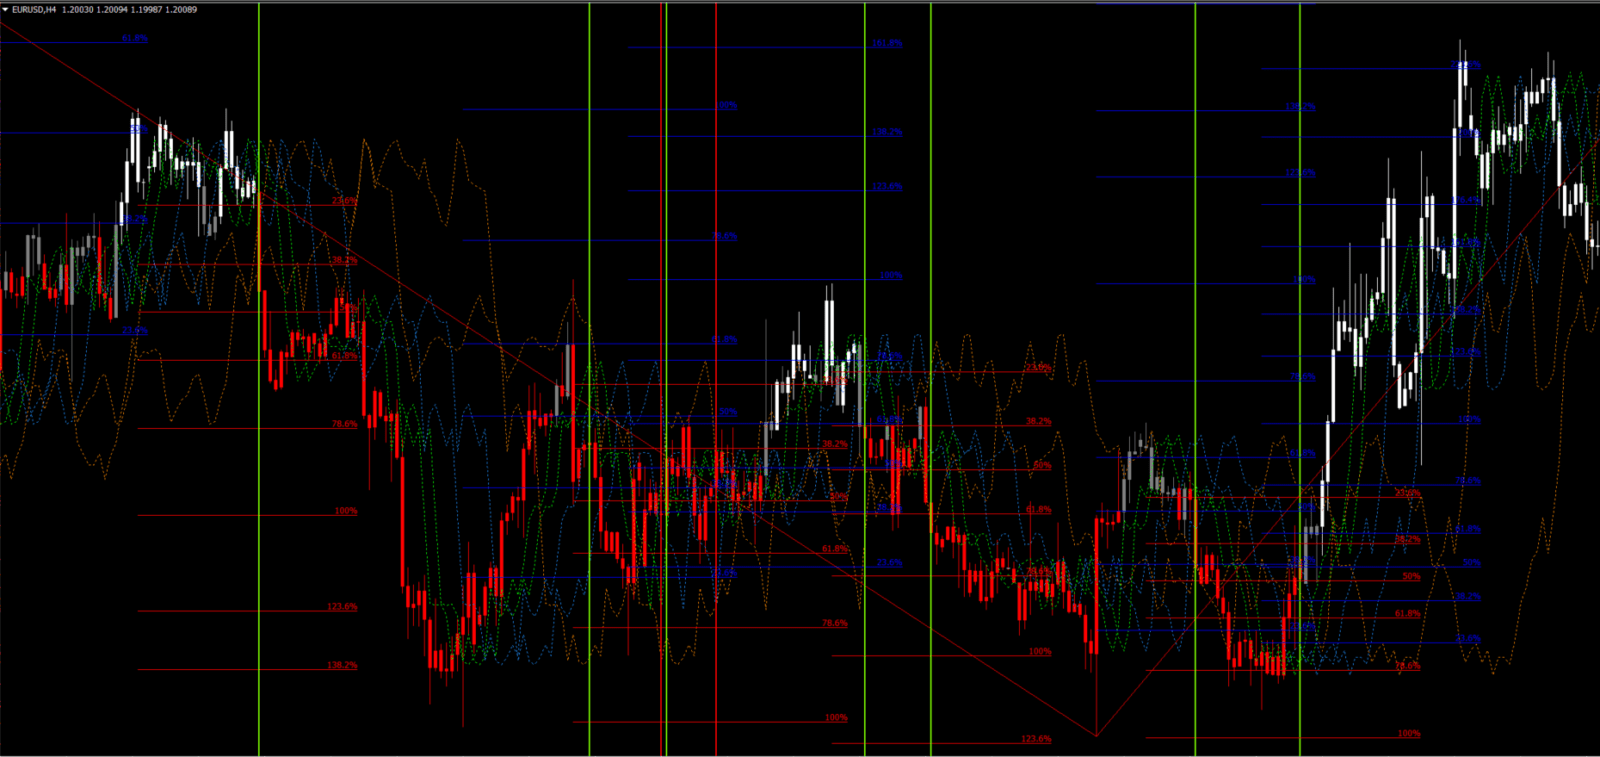
Price Indicators: Avoiding the Trap of Paralysis of Analysis
At first, glance, adding more price indicators makes sense. Traders receive more information about the price chart of choice. In turn, this extra information should provide better decisions. Who would not want that? Unfortunately, the reality is different for many traders. Adding more price indicators does lead to more information, but also to opposite signals and opposing views. For instance, price action could be reaching a Fibonacci support level while breaking a band for a bearish breakout. Which advice do you follow? Of course, traders can avoid taking any decisions and stay out of the market. But if all the indicators are indicating the opposite, then there would be no trades left. Simply said, adding 100 indicators will not make your trading decisions easier. It will only clutter your analysis and charts.Price Indicators: Finding The Right Balance
How do you solve it? There are two aspects that can help:- Do not over clutter the charts with too many indicators.
- Only use indicators that have a specific role in your analysis and trading decisions.
Choosing The Right Number Of Indicators
Each and every trader will have their own ideal number. The ideas mentioned here are general recommendations. But often traders tend to use a few indicators, ranging from 2-3 on the low side to 5-10 on the higher side. Most traders agree that using more than 10 or 20 indicators starts to become unproductive. The costs start to outweigh the benefits because traders become confused by the overload of information. The image below indicates how most traders approach the choice of indicators.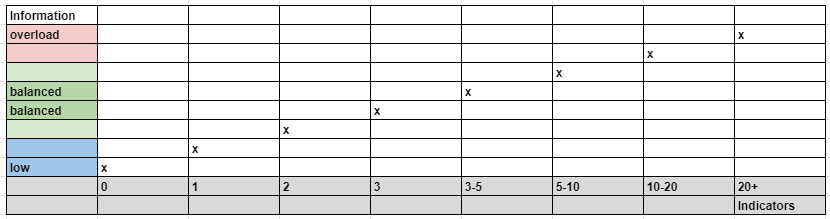
Assign Roles To The Indicators
Each indicator should have a specific role when using them. It makes no sense to add 10 indicators that help you determine the trend. One or a few indicators should be enough for that particular purpose. By using an indicator for one or two purposes only, we make sure that the information from the indicator is used within a concrete and clear trading plan. This helps you avoid getting distracted when indicators have less importance. Traders can assign many roles but most agree on this division:- Trend indicator
- Momentum indicator
- Support and resistance indicator
- Divergence indicator
- Pattern indicator
- Breakout indicator
Price Indicators: Combining Indicators For Your Trading Plan
Price indicators should have a clear role in any trading plan. Otherwise, the indicator is just taking up space and making you feel confused. The advantage of using the 6 roles (see paragraph above) is that you know why the price indicator is on your chart. It should have a clear part in your trading plan. Each category can have 1, 2 or even 3 indicators. Keep in mind that one indicator can be used for multiple roles as well. Let’s explain each indicator category.Trend Indicator
This indicator is used to determine the direction of the trend.- Usually, 1 indicator is enough. But you can use two or three. For instance, moving averages are often the most used indicator. But traders often also add trend channels to their charts.
Momentum Indicator
- This indicator shows the speed of price action
- Traders can use a moving average too (short one), a parabolic, or bands.
Support And Resistance Indicator
- This indicator shows key support and resistance levels.
- Traders can use Fibonacci, Murrey Math, pivot points, Ichimoku.
Divergence Indicator
- This indicator compares price action with price momentum. If the two do not match, then a divergence pattern emerges and this indicates a slow down of the trend.
- Traders can use the MACD, Awesome Oscillator, RSI.
Pattern Indicator
- This indicator helps traders identify charts and wave patterns.
- Traders can use moving averages, trend lines, the zigzag indicator, etc.
Breakout Indicator
- This indicator helps traders to spot moments when the price is making a breakout.
- Traders can use the Fractal indicator, trend lines, bands, and envelopes.
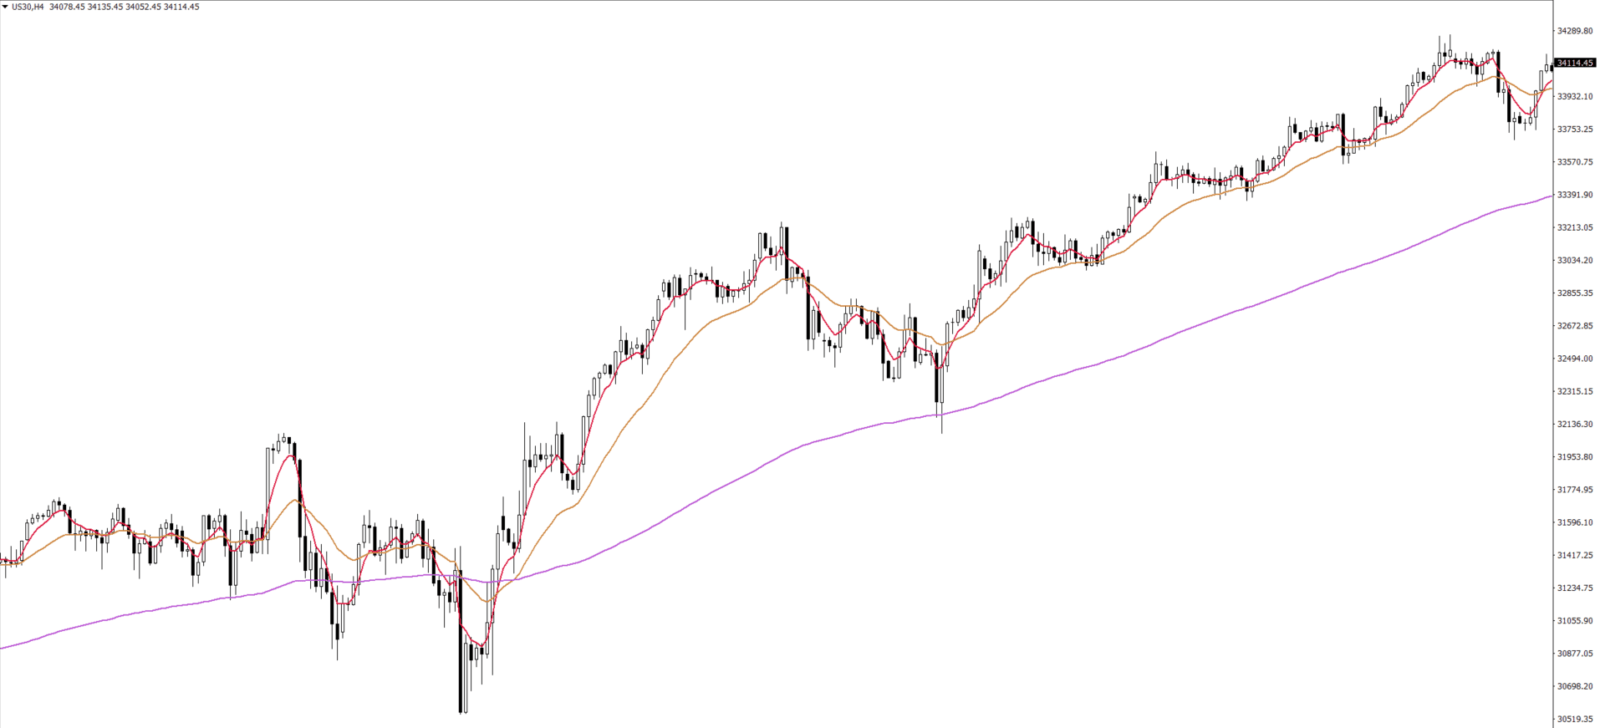
Price Indicators: Combining MAs, Fibonacci, And Fractals
The moving average is a particularly useful indicator because it can serve well in multiple roles and instances.The Trend
In this practical example, we will use the moving averages for determining the trend. Let’s use the Fibonacci numbers 21 ema and 144 ema for that. The 21 ema indicates the short-term trend whereas the 144 ema is the long-term trend:- Uptrend = price is above the 21 ema which is above the 144 ema.
- Downtrend = price is below the 21 ema which is below the 144 ema.
Momentum
For this part, we can use the moving average again. But we need a faster-moving average than with the trend. For instance, a 5 ema close could work well or an HMA 20.- Bullish momentum = bullish angle of 5 ema.
- Bearish momentum = bearish angle of 5 ema.
 Volver